
Fig. 4.
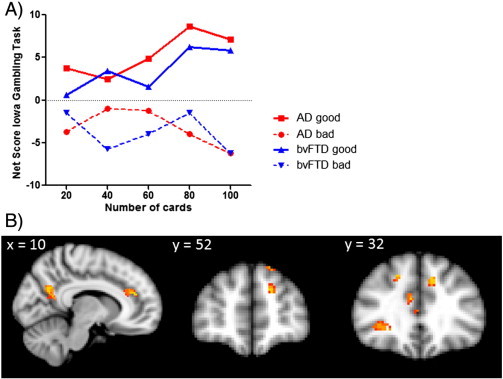
A) shows the behavioural performance of high vs. low bvFTD and AD performers for the total IGT net score across trials; B) Voxel-based morphometry analyses showing grey matter atrophy for poor versus good performers on the IGT. Clusters are overlaid on the MNI standard brain (t > 2.41). Coloured voxels show regions that were significant in the analyses for p < 0.01 FDR corrected and a cluster threshold of 50 contiguous voxels.