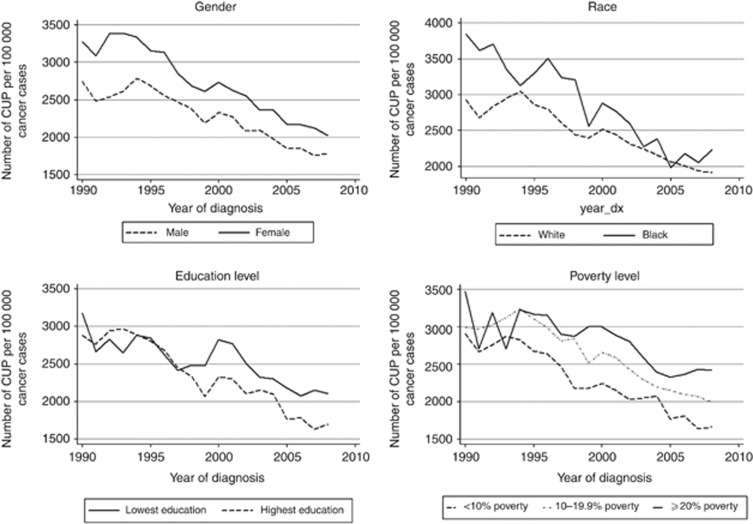
Figure 2.
Proportion of CUP diagnoses per 100 000 cancers by socioeconomic factors (gender, race, education and poverty level). Proportion was calculated as a percentage of all cancers diagnosed as CUP within each subgroup per year. Education status was defined by the percentage of people having at least a bachelor's degree registered as a county attribute in SEER. The lowest and highest education quartiles are graphed. Poverty was categorised into three groups based on the median regional income: affluent (<10%), middle (10–19.9%) and poor (⩾20%).

