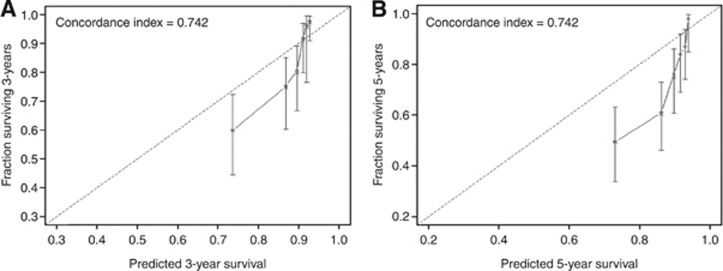
Figure 2.
Calibration plots depicting the correlation between predicted and actual cancer-specific mortality. (A) Nomogram-predicted probability of 3-year cancer-specific survival. (B) Nomogram-predicted probability of 5-year cancer-specific survival. The line containing error bars (95% CI) represents the performance of the models applied to the observed fractions surviving.

