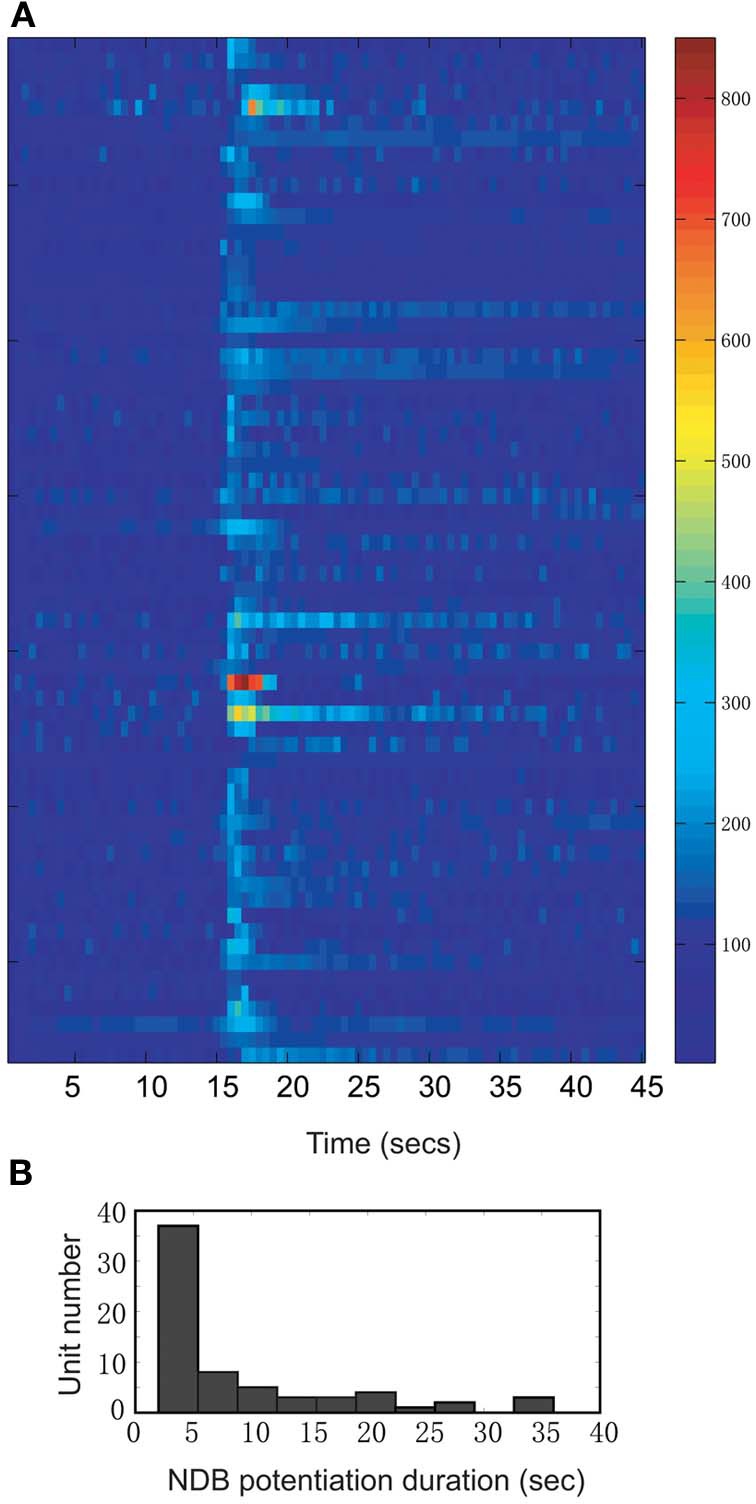
Figure 2.

A summary of all units showing increased firing rate following electrical stimulation (n = 66; Bin = 0.5 s). (A) The time course records are normalized to the baseline period 12–15 s. The color bar on the right indicates the normalized spike rates (%). (B) Distribution of NDB potentiation shows the range of duration from 2 to 35 s.
