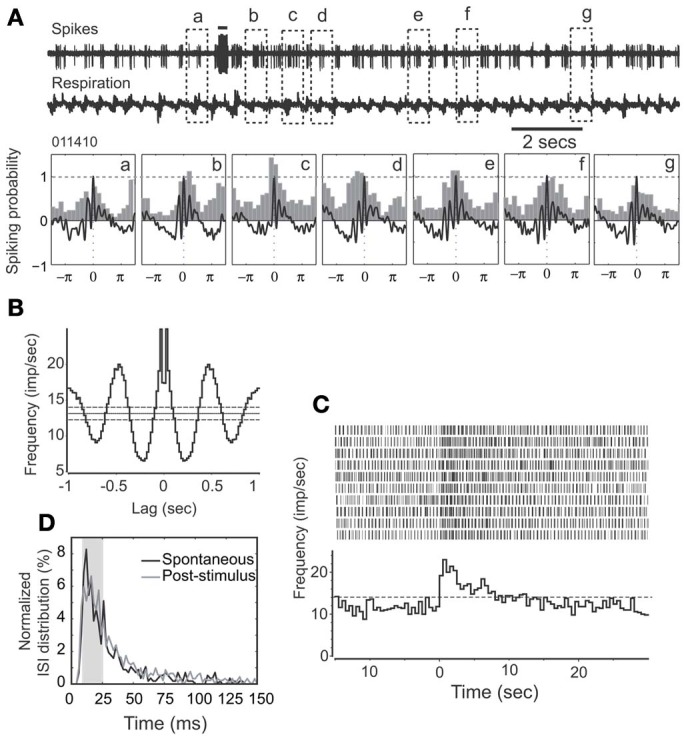
Figure 3.

HDB stimulation does not affect synchronization pattern of a rhythmically spiking unit. (A) Raw traces show spikes and respiration recorded simultaneously. Note that the unit remains synchronized with respiration following HDB stimulation. This unit has a long-lasting discharge activity. Lower panel: The respiration triggered spike histograms are shown before (a) or after stimulation (b–g). Respiration traces are averaged and 0 stands for the transition point between inhalation and exhalation. The top bar: electrical stimulation (100 μs, 400 μA, 100 Hz, 25 pulses). (B) An autocorrelation analysis indicates the unit has a rhythmicity of 3 Hz at a confidence limit of 99% (bin = 20 ms). (C) Histogram and raster plot showing stimulation effects on mean spike rates. Note t = 0 indicates the beginning of NDB stimulation, and this applies to the rest of Figures. (D) Plot showing ISI distributions before or after stimulation, respectively. Note that ISIs following NDB stimulation are decreased (p < 0.001).
