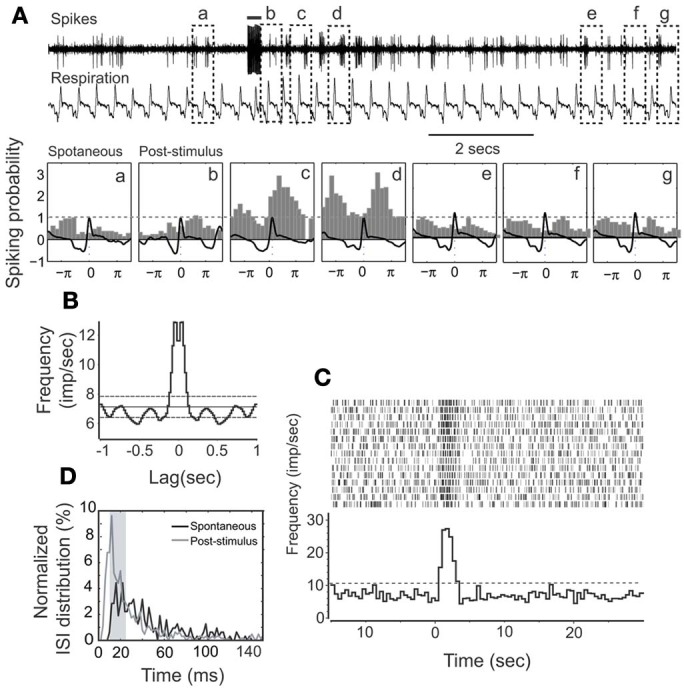
Figure 4.

HDB stimulation on a non-synchronized, rhythmically spiking unit. (A) Raw traces show the simultaneous recording of spikes and respiration. This unit has a short-lasting discharging activity. The bar on the top shows the electrical stimulation (100 μ s, 500 μ A, 100 Hz, 25 pulses). The respiration triggered spike histograms are shown before (a) or after stimulation (b–g) as described in Figure 3. (B) An autocorrelation analysis indicates the unit rhythmicity (Bin = 20 ms). (C) Histogram and raster plot showing potentiation of spike rates. (D) Plot showing ISI distributions before or after stimulation, respectively. Note that ISIs following NDB stimulation are decreased (p < 0.001).
