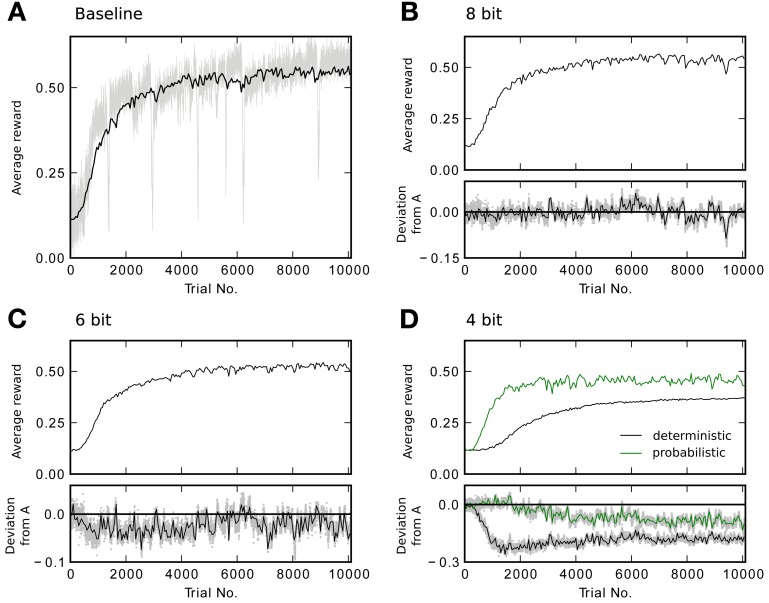
Figure 5.
Reward traces showing the running average (only every 50th point plotted) for different weight resolutions averaged over 20 runs. (A) Baseline performance with continuous weights. Additionally, the light gray trace shows the reward R for every trial of a single simulation. (B) Performance with 8 bit resolution. The lower plot shows the difference to the baseline model in (A). The shaded area shows the difference for every point in the trace instead of only for every 50th. (C) Performance with 6 bit resolution. (D) Performance with 4 bit resolution. The black trace shows the result for deterministic updates. The green trace for probabilistic updates.

