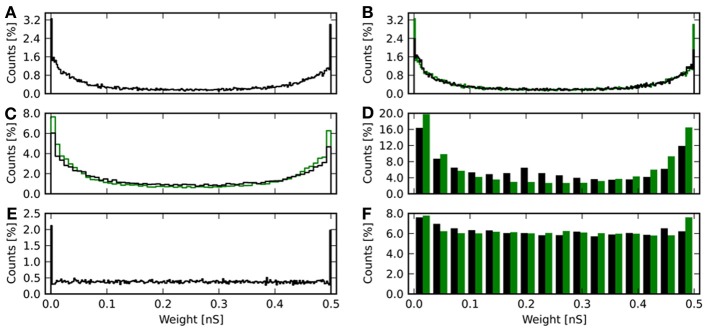
Figure 7.

Histograms of synaptic weights after learning. The weights from all 20 repetitions for each resolution and update mode are shown. (A) Continuous weights. (B) 8 bit weights in black. Continuous weights are discretized to this resolution and shown in green. (C) 6 bit weights in black, again with equally binned continuous weights in green. (D) 4 bit weights with deterministic updates in black and the continuous result in green. (E) Final weights for the baseline simulation with artificially added noise, of which the reward trace is shown in Figure 6. (F) Final weight histogram for 4 bit resolution with probabilistic updates in black. Now the green bars give the distribution of weights from the baseline simulation with added noise.
