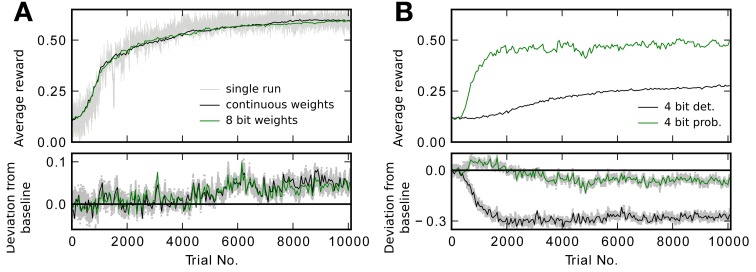
Figure 8.
Performance with threshold readout. As in Figure 5 the running average of the reward is plotted averaged over 20 runs. The lower plots show the difference to the baseline trace in Figure 5A. (A) Performance traces for continuous and 8 bit weights. In gray reward R for every trial in a single run with continuous weights is shown. (B) Performance traces for 4 bit resolution with deterministic and probabilistic updates.

