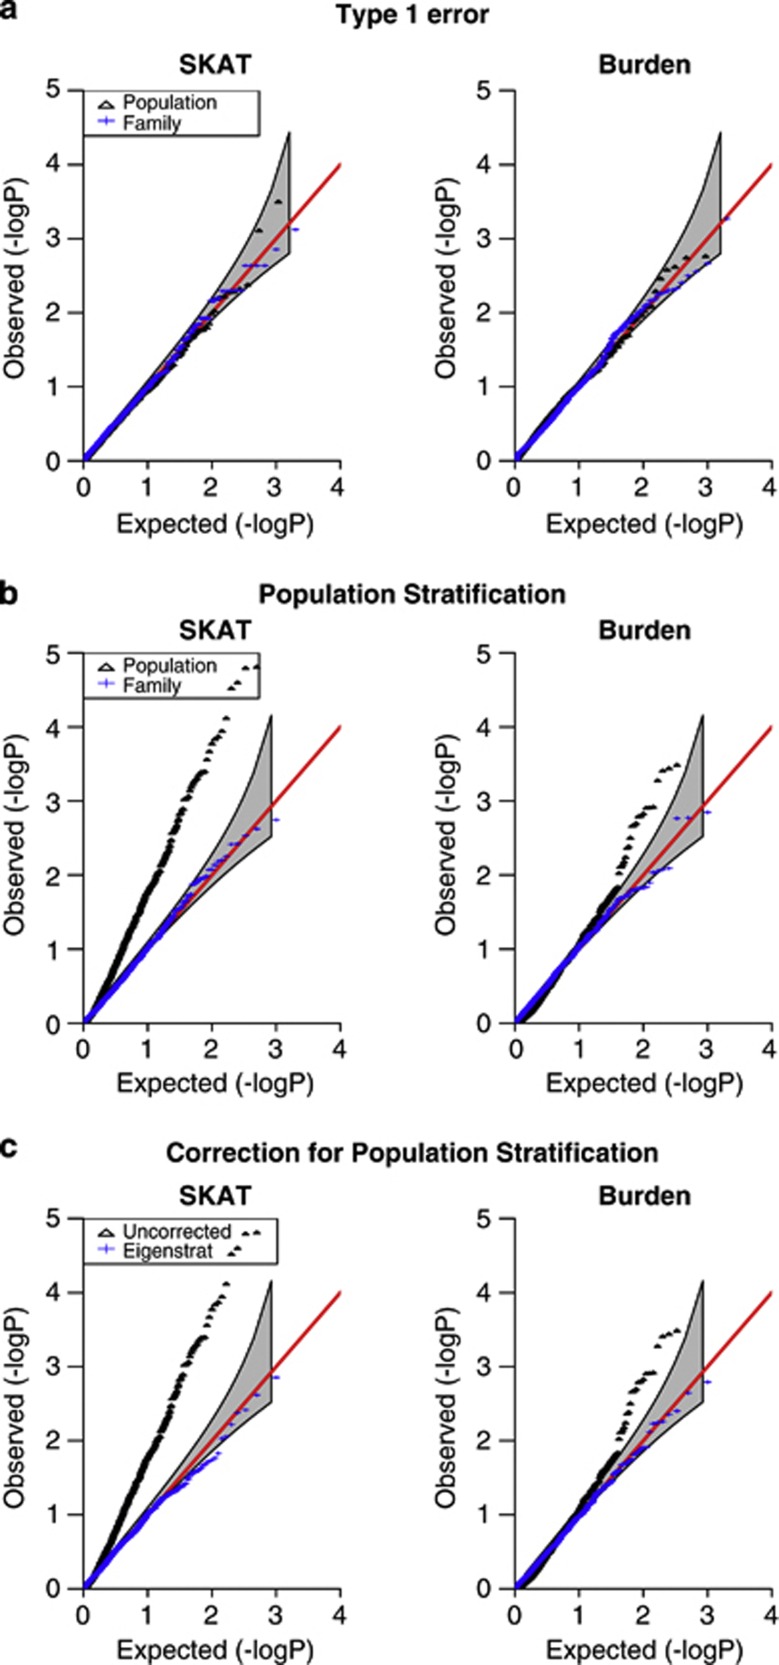
Figure 1.
Type 1 error, dichotomous trait. Results for the SKAT test and for the Burden test are shown, for both the trio design with n=500 trios and the case–control design with n=500 cases and n=500 controls. Ninety-five percent CI is also shown. (a) No population stratification, (b) in the presence of population stratification, (c) with Eigenstrat correction for population stratification.

