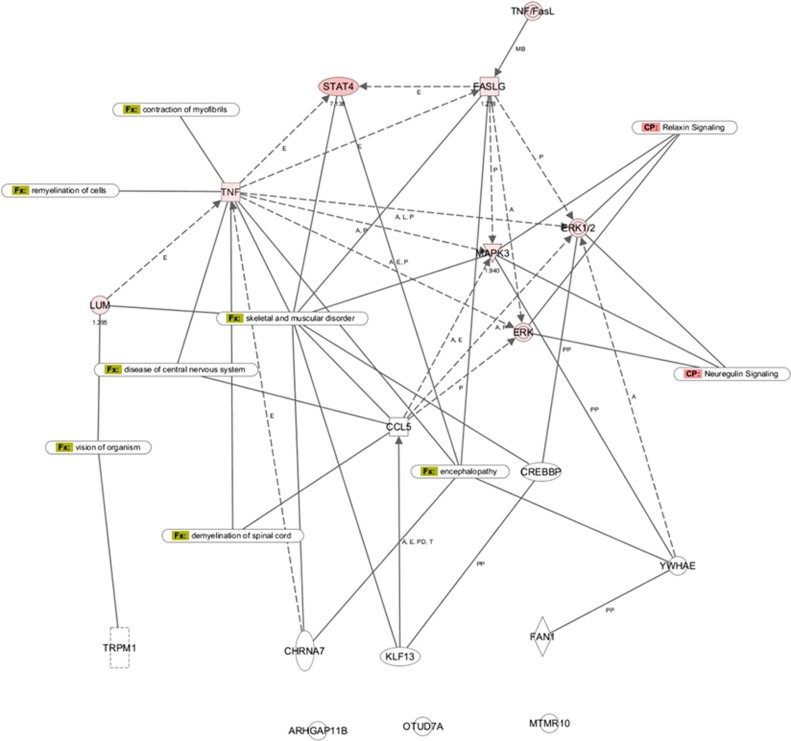
Figure 3.
Assessment of relationships between genes from 15q13.3 and 267 genes that had altered expression in lymphoblastoid cells from the proband, relative to cells from age- and sex-matched control subjects. Known functional associations are also shown (derived from the Ingenuity Pathway Analysis).

