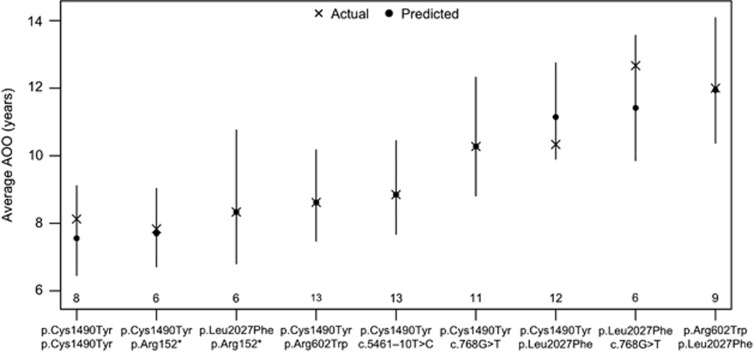
Figure 1.
Graph depicting the actual and predicted average AOO with 95% confidence bands for each mutation combination observed in five or more patients. Statistically significant differences in the AOO between mutation combinations are identified by non-overlapping confidence intervals. The numbers of subjects with each mutation combination are indicated above the horizontal axis.

