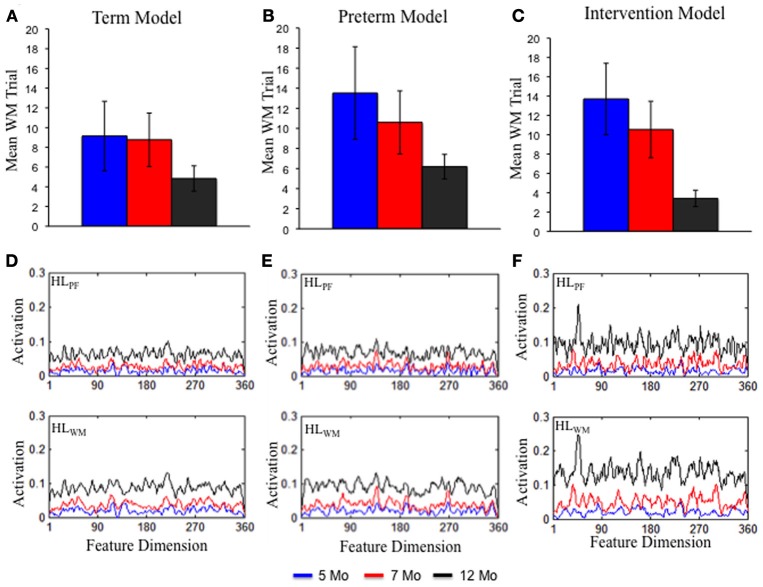
Figure 5.
The top shows the rate at which DNF model formed a stable WM peak for the term (A), preterm (B), and intervention (C) models at 5 (blue), 7 (red), and 12 (black) months of age. Over development, all models formed a stable WM peak more quickly. The rate of WM peak formation was delayed for the preterm model but enhanced by 12 months of age for the intervention model. The bottom shows the experience accumulated in HLPF and HLWM for the term (D), preterm (E), and intervention (F) models. The strength of activation in the Hebbian layers was comparable for the term and preterm infant models. It was stronger for the intervention model.

