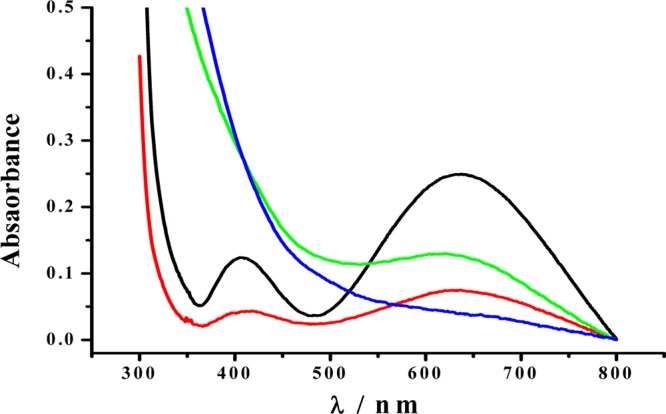
Figure 7.

UV–vis spectra of 250 μM DA–Fe(III)–ATP (black curve), a mixture of 250 μM DA, 250 μM ATP, and 0.15 mg/mL ferritin incubated for 0 h (blue), the same ferritin-containing mixture after 21 h of incubation (green), and the same mixture incubated for 21 h followed by removal of ferritin (red).
