. 2013 Sep 17;2:e01074. doi: 10.7554/eLife.01074

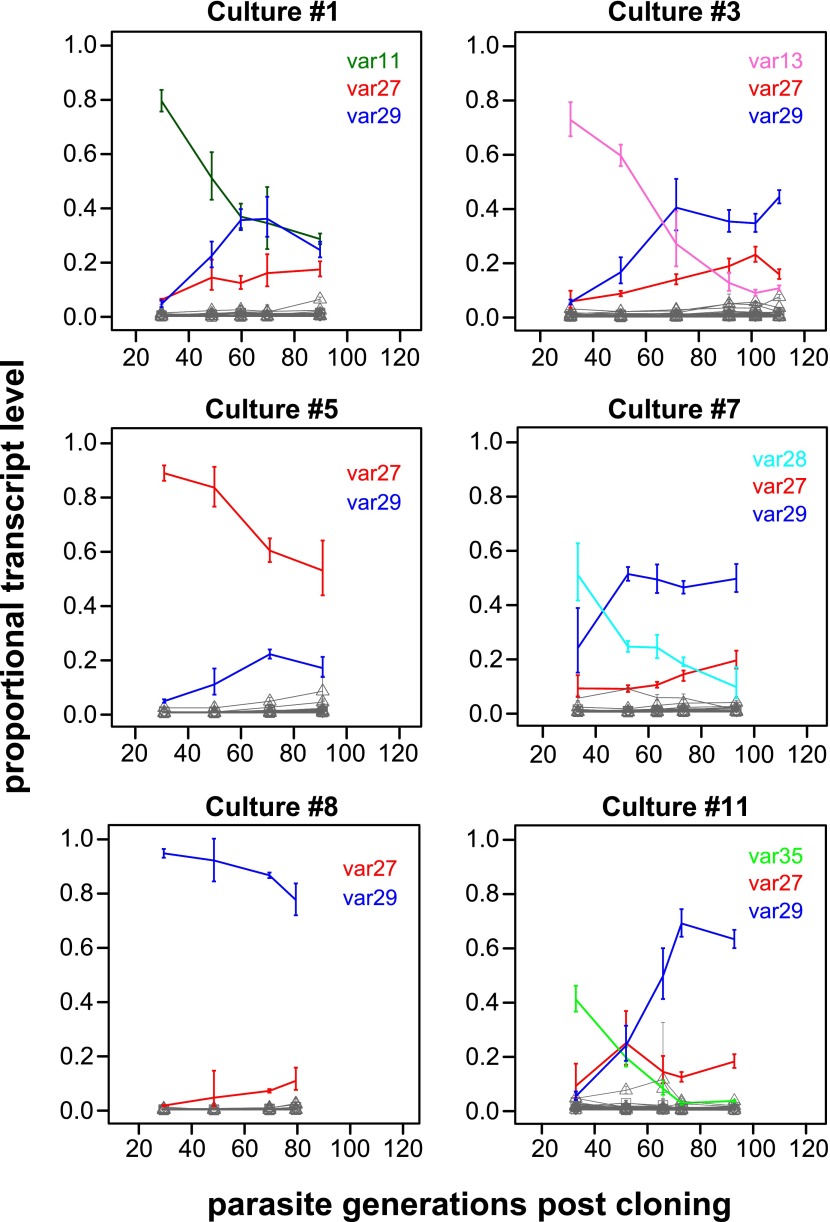
Figure 1. Proportional var transcript levels for six in vitro cultures.

The parasite cultures initially expressed a variety of dominant ‘starter genes’, which switched off at notably different rates. Nevertheless, most cultures converged towards high level transcription of two centrally located genes var27 and var29 (red and blue lines, respectively), whereas most other gene transcripts (grey lines) remained at relatively low levels.

DOI: http://dx.doi.org/10.7554/eLife.01074.004

Figure 1.

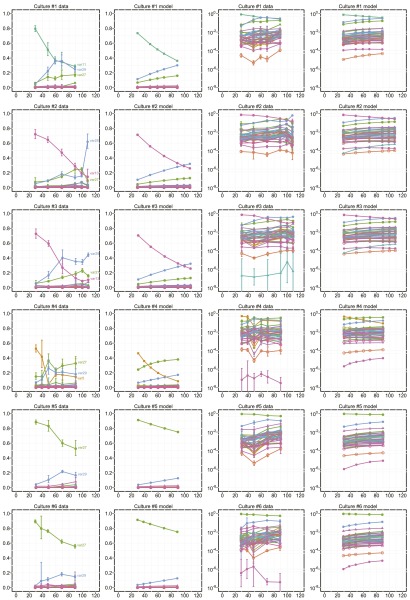
Figure 1—figure supplement 1. Proportional var transcript levels and model output for cultures 1–6.

Figure 1—figure supplement 1.

The relative transcript levels of activated var genes were measured by qRT-PCR at various time points during in vitro culture for 11 clones with different starter genes, plus the parent culture. Columns one and two show the measured transcript levels at linear and logarithmic scale, respectively; columns three and four show the model fit. Error bars show approximate 95% confidence intervals estimated from qRT-PCR replicates.
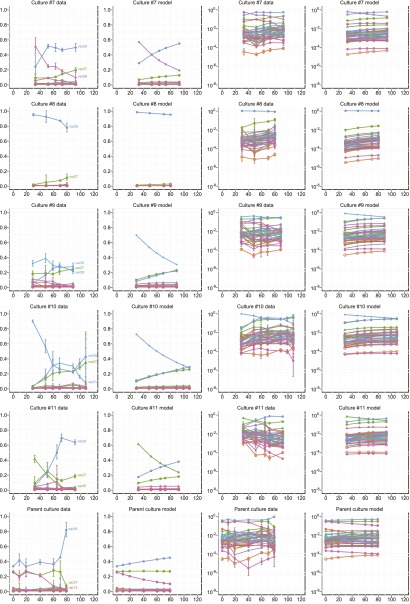
Figure 1—figure supplement 2. Proportional var transcript levels and model output for cultures 7–11.

Figure 1—figure supplement 2.

The relative transcript levels of activated var genes were measured by qRT-PCR at various time points during in vitro culture for 11 clones with different starter genes, plus the parent culture. Columns one and two show the measured transcript levels at linear and logarithmic scale, respectively; columns three and four show the model fit. Error bars show approximate 95% confidence intervals estimated from qRT-PCR replicates.