
Figure 6. Effect of var gene activation on sequence evolution.
(A) Var gene activation biases are significantly correlated with each gene’s relatedness to the rest of the HB3 repertoire, as measured by the gene’s centrality within a shared homology block network, independently of chromosomal location or gene length. Trend lines show the fit of a linear regression model. (B) Simulation of var gene evolution by gene conversion, whereby homology blocks are swapped among pairs of genes chosen at random according to their activation biases, shows a similar correlation between the genes’ activation biases and their relatedness to the rest of the repertoire. The red points show the outcome of one simulation, and the dashed line is the smoothed average of 50 runs. (C) Activation biases are negatively correlated with the gene’s average domain sequence conservation, as a measure of population-level diversity, independently of chromosomal location and gene length. Trend lines show the fit of a linear regression model.
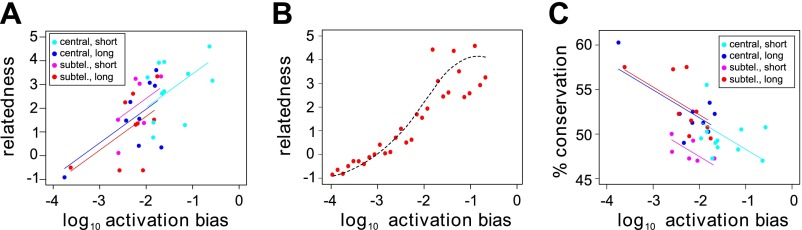
Figure 6—figure supplement 1. Relatedness network of the HB3 repertoire.
