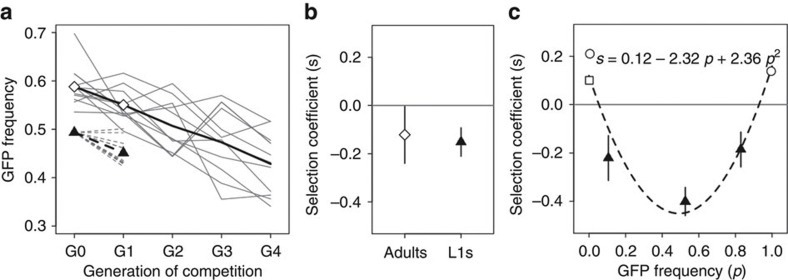
Figure 3. Frequency-dependent selection.
(a) The GFP allele is deleterious. Intermediate-frequency competitions between the GFP and the wild-type inbred lines show that the GFP allele declines in frequency. GFP allele frequency changes are shown for 11 replicate competitions (grey lines). The mean GFP frequency in adults through time is shown as a black line. The mean selection coefficient estimated from multiple generations, at the adult stage, is s=−0.12±0.03 s.d. (see Methods). The frequency declines in GFP allele observed over one generation both at the L1 stage (dashed grey lines) and at the adult stage (solid grey lines) are shown. (b) Estimated selection coefficients at adult and L1 stages for GFP allele frequency changes in a single generation, from a (symbols), show no effect of life-history stage (Welch’s t-test, t14.7=−0.45, P=0.66). Error bars indicate 2 s.e.m. among the 10 replicates at each stage. (c) The form of frequency-dependent selection. Estimated selection coefficients from one-generation competition experiments at several intermediate initial GFP frequencies are shown as triangles. Measurements were done at the L1 stage. Error bars indicate 2 s.e.m. among the 10 replicates for each starting frequency. Selection coefficient estimates from the invasion experiments with two (square) or five (circle) starting GFP individuals are also shown as empty symbols (from the data in Figs 1c and 2a). Note that the selection coefficient estimated from the invasion experiment where the GFP allele was at an initial proportion of 0.995 is the absolute selection coefficient of the wild-type invader allele. Frequency-dependent selection is illustrated by a quadratic regression on all data points (R2=0.91; inset). Neutrality is indicated as a grey line.

