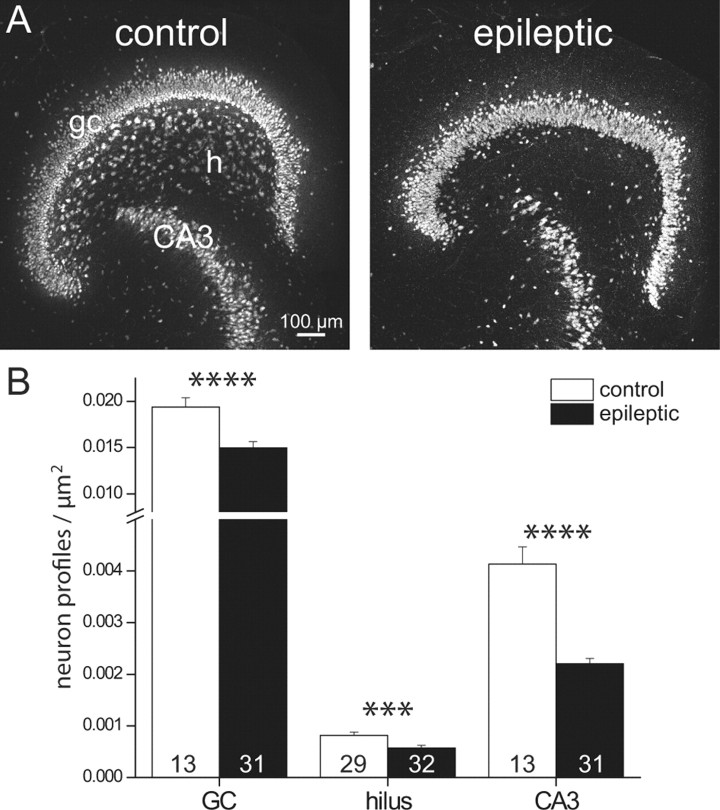
Figure 4.
Neuron profile density was reduced in epileptic rats. A, NeuN-immunostained section of a slice from a control (left) and epileptic rat (right). gc, Granule cell layer; h, hilus; CA3, CA3 pyramidal cell layer. B, Group data reveal reduced neuron profile densities in epileptic rats. The number of slices is indicated in bars. Graphed values represent mean ± SEM. ***p < 0.005; ****p < 0.001.

