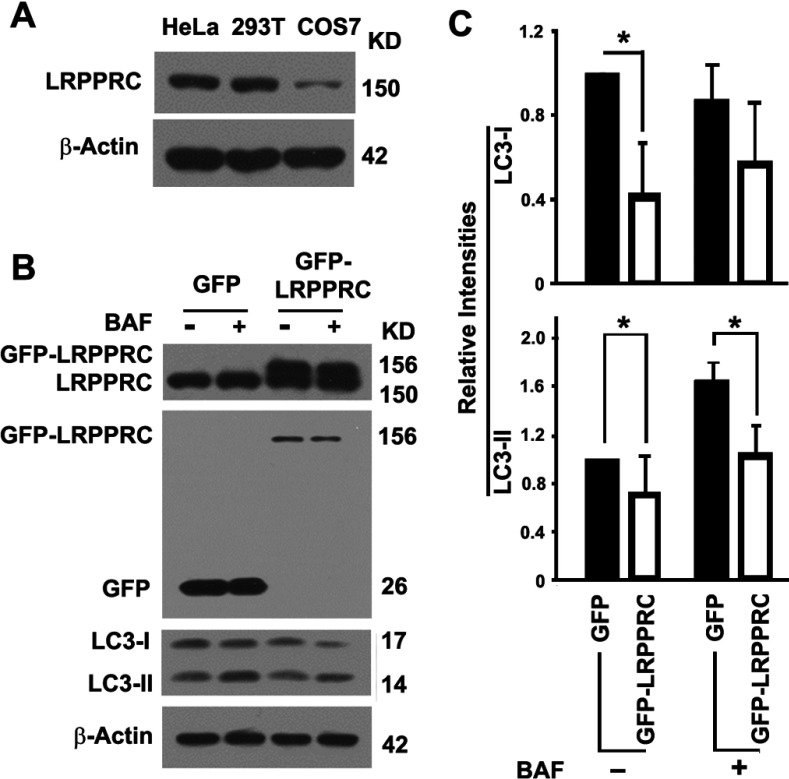
Figure 4. Overexpression of LRPPRC leads to inhibition of basal levels of autophagy in COS7 cells.
(A) Immunoblot analysis of LRPPRC protein levels in different types of cells. Lysates with the same amount of total proteins prepared from HeLa, HEK-293T and COS7 cells were compared. Molecular masses are indicated in kDa. (B) Immunoblot analyses of LC3 levels in lysates from COS7 cells overexpressing GFP or GFP–LRPPRC in the absence (−) or presence (+) of lysosomal inhibitor bafilomycin A1 (BAF). Expression levels of LRPPRC were confirmed by immunoblotting with antibodies against LRPPRC (top panel) or GFP (second panel). Molecular masses are indicated in kDa. (C) Plots of relative intensities of LC3-I and LC3-II bands with representative images shown in (B). The intensities in cells expressing GFP in the absence of lysosomal inhibitor were set to 1. Results are means±S.D. of at least three repeats and the differences were compared using a paired Student's t test. *P≤0.05.

