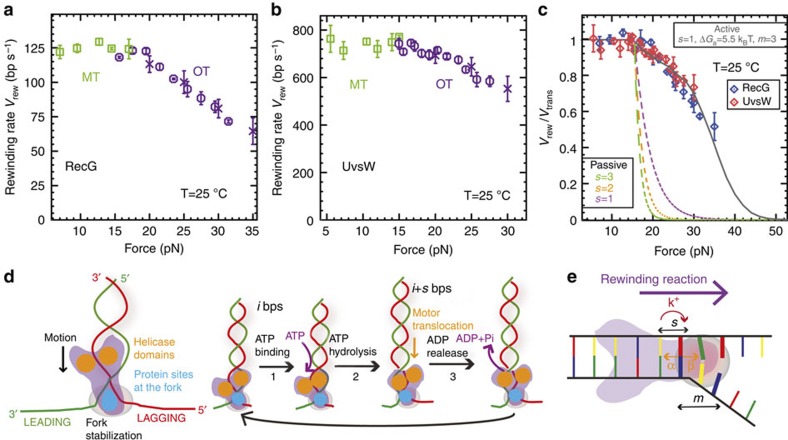
Figure 3. RecG and UvsW catalyse efficient rewinding reactions against large opposing forces.
(a,b) Mean rate of rewinding as a function of force for RecG (a, number n of experimental traces analysed from 56 to 428 depending on the conditions) and UvsW (b, n from 37 to 214 depending on the conditions) at 25 °C. Reactions were carried out using MT (green squares) for forces ≤15 pN and OT (purple circles and crosses) for opposing forces ≥15 pN. Rates at high forces are computed as described in Methods both from OT-passive data (Fig. 2, purple circles) and from OT force-jump data (Supplementary Fig. S3, purple crosses). Error bars are s.e.m. (c) The experimentally measured rate of rewinding for RecG (blue circles) and UvsW (red diamonds) normalized to the maximum rate of rewinding as a function of the force. Error bars are s.e.m. The results are compared with the predictions obtained from the extended model for a passive enzyme with different step sizes and for an active enzyme model that agrees very well with the experimental results (s=1, ΔGa=5.5 kBT, m=3). (d) Rewinding scheme based on that previously proposed for RecG fork regression18. Helicase domains are marked in yellow, whereas the protein region that makes contact with the fork is shown in blue (for example, wedge domain of RecG). Along the ATP cycle at least three different states can be considered: protein without nucleotide bound (1), protein with ATP bound (2) and protein with ADP bound (3). (e) Schematics of the extended model used to describe the UvsW and RecG rewinding behaviours: α and β are the base pair opening and closing rates; k+ is the forward translocation rate; s is the enzyme step size and m is the range of the protein–DNA interaction potential (in the figure s=1 and m=3).

