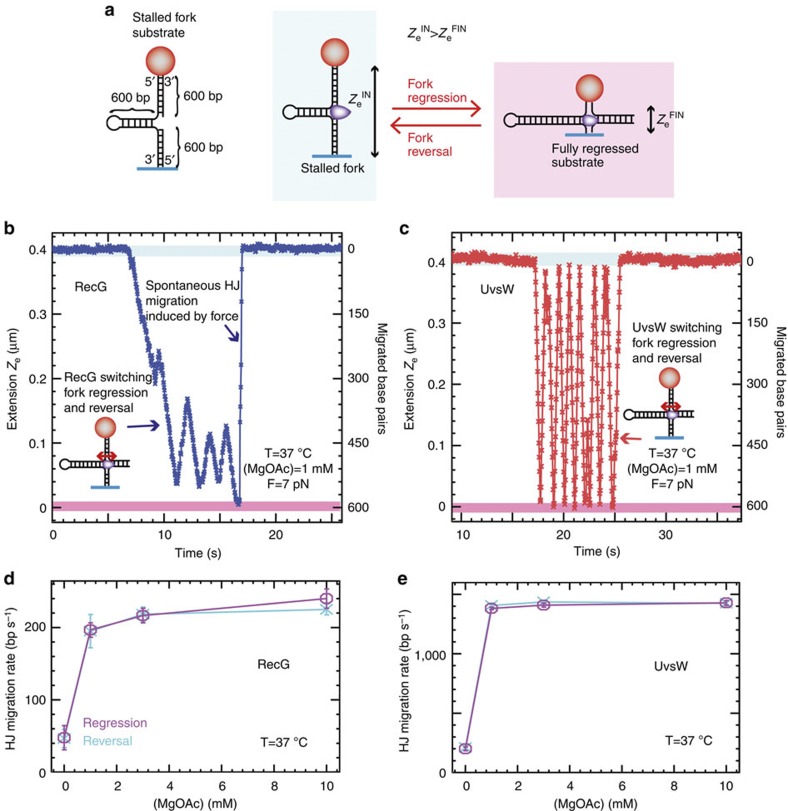
Figure 5. RecG and UvsW catalyse the Holliday junction formation and migration from a stalled fork intermediate.
(a) Schematic of the stalled fork substrate and the fork regression and HJ branch migration reaction. (b,c) RecG and UvsW branch migration traces performed in a buffer containing 1 mM MgOAc at 37 °C. The molecular extensions corresponding to the initial stalled fork and the final fully regressed configurations are highlighted in light blue and pink, respectively. (d,e) RecG (d, number of experimental traces analysed n from 64 to 126 depending on the conditions) and UvsW (e, n from 53 to 209 depending on the conditions) mean branch-migration rate during fork regression (magenta) and fork reversal (cyan) at 7 pN as a function of the MgOAc concentration. Error bars are s.e.m.

