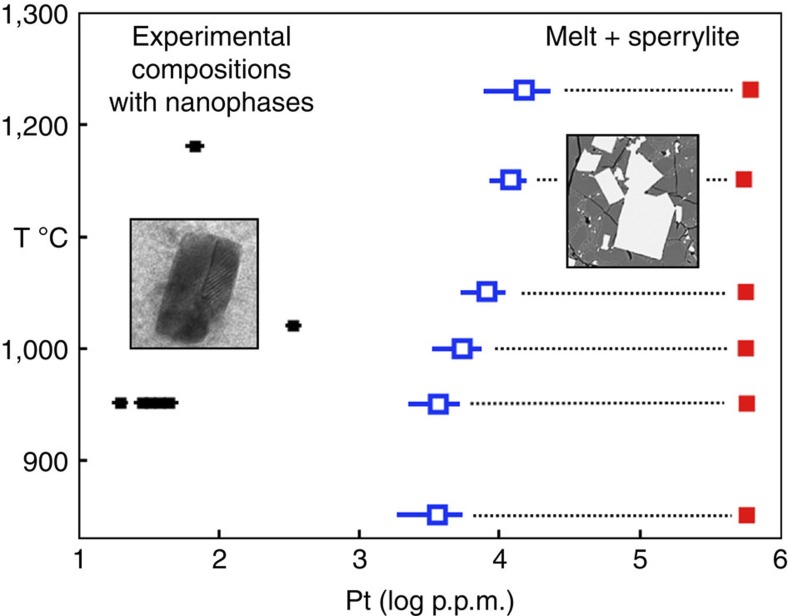
Figure 1. Phase relations.
Phase diagram of the platinum–arsenic-bearing Fe-(Cu)-S systems determined at an S2 partial pressure corresponding to the Fe1−xS–S2 liquid–vapour equilibrium20. Blue symbols—compositions of sperrylite-saturated Fe-(Cu)-S melts (~5,000–6,000 p.p.m. Pt). Red symbols—sperrylite compositions. Small black symbols—sperrylite-undersaturated melts analysed for Pt–As distribution and/or FIB sectioned in search of Pt–As nanophases and nanoparticles. The insets illustrate the compositional regions where macroscopic sperrylite (euhedral, bright) is stable and where (Pt–As)n nanophases are found. Error bars are 2 sigma of the mean.

