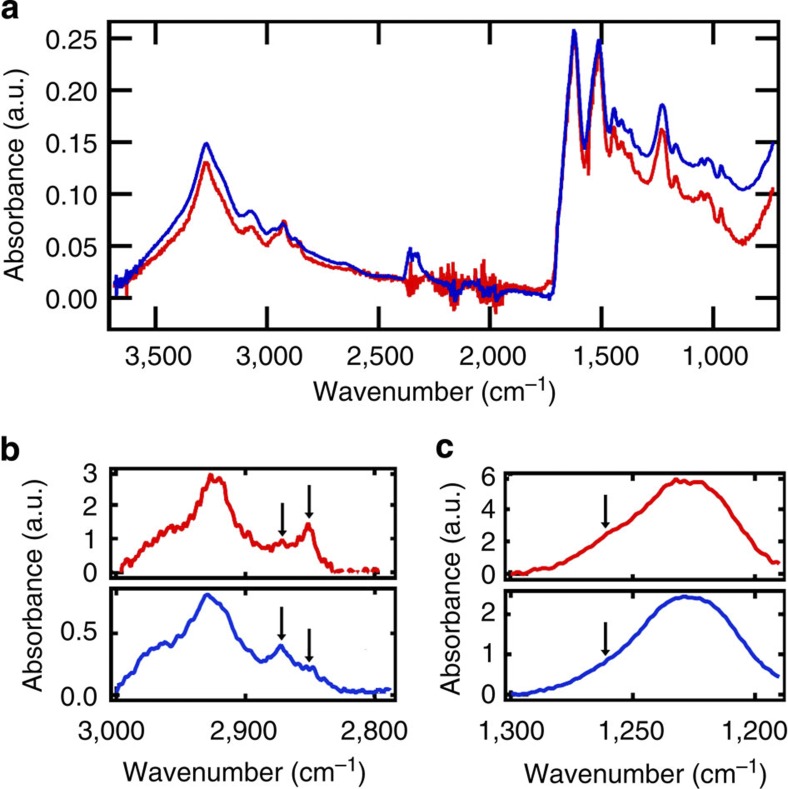
Figure 3. FTIR spectra of neat and f-CNT-SS fibres.
(a) Combined FTIR spectra normalised to the amide I peak at 1,625 cm−1 (red: neat fibres, blue: f-CNT-SS). (b) Expanded view of the spectra between 3,000 and 2,800 cm−1. Arrows indicate the position of the peaks of interest. (c) Expanded view of the spectra near amide III region. A subtle reduction in the peak intensity near 1,260 cm−1 is observed after f-CNT coating.

