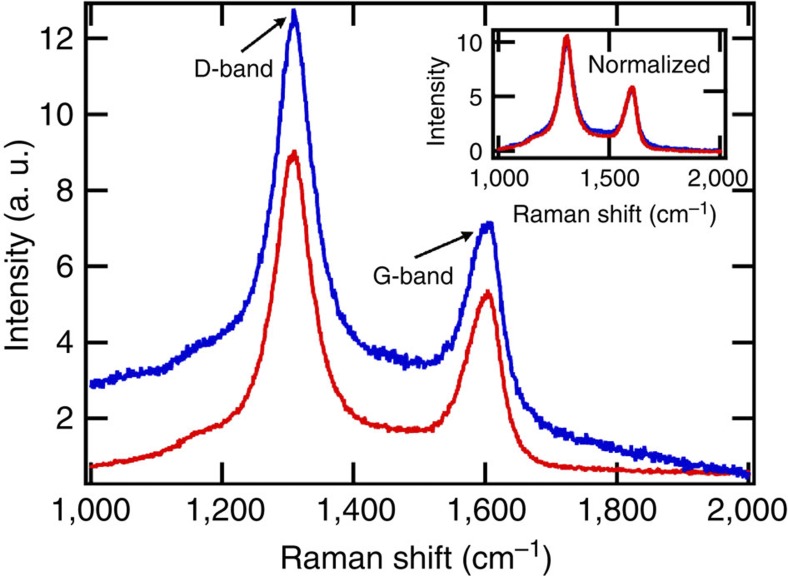
Figure 4. Raman spectra of f-CNT-SS fibre and dry f-CNT powder.
The f-CNT-SS spectrum has been offset to show the linear background contribution more clearly (blue: f-CNT-SS fibre, red: dry f-CNT powder). Inset shows background-subtracted and normalized spectrum of f-CNT-SS, showing an overlap with the spectrum of the control sample.

