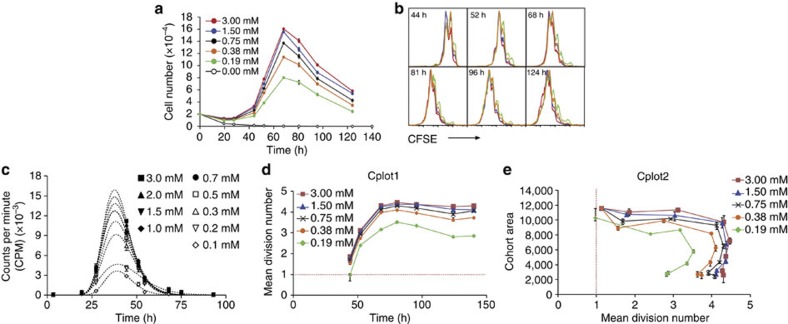
Figure 1. Quantitative analysis of CpG stimulation.
Naive B cells were labelled with CFSE and stimulated with indicated concentrations of CpG DNA. (a) Measurement of total cell numbers over time in response to CpG titration. Data points=mean±s.e.m. of triplicate cultures. (b) Division progression of B cells was determined by dilution of CFSE. (c) Mean time to first division in response to CpG stimulation was quantified by measuring 3H thymidine incorporation during a 1-h pulse in the presence of the cell cycle-inhibitor colcemid. Data points=mean±s.e.m. of triplicate cultures. (d) Cohort analysis was used to measure the mean division number of individual cohorts. Cplot1 were then constructed by plotting data against collection time to visualize the change in maximum division number (division destiny) and division rate with CpG concentration. Red line=intercept with 1 and approximate time to first division. (e) Cohort analysis was used to measure the area of individual cohorts, and therefore number of cells at each time point. Cplot2 was then generated by plotting cohort area against mean division number from Cplot1. Cplot2 was used to approximate changes in death with concentration of CpG. Error bars in d and e represent 95% confidence intervals. All data are representative of three independent experiments.

