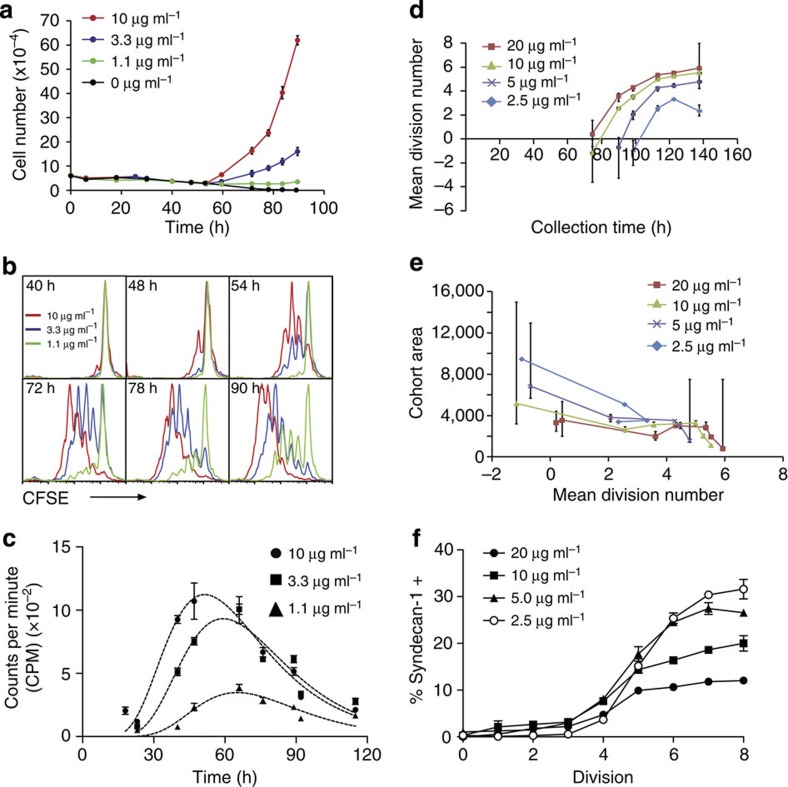
Figure 3. Quantitative analysis of CD40 stimulation.
Naive B cells were labelled with CFSE and stimulated with indicated concentrations of αCD40 antibody in the presence of constant IL-4. (a) Measurement of total cell numbers over time in response to αCD40 titration. Data points=mean±s.e.m. of triplicate cultures. (b) Division progression of B cells was determined by dilution of CFSE. (c) Colcemid plot of mean time to first division in response to CD40 stimulation. Data points=mean±s.e.m. of triplicate cultures. (d) Cplot1 of cohort analysis of αCD40 data to visualize the change in maximum division number (division destiny) and division rate with αCD40 concentration. Red line=intercept with 1 and approximate time to first division. (e) Cplot2 was used to approximate changes in death with concentration of αCD40. Error bars in d and e represent 95% confidence intervals. (f) Proportion of syndecan-1+ cells per division was measured at day 5 in cultures containing CFSE-labelled B cells stimulated with αCD40. Data points represent the mean and s.e.m. of three replicate samples and are representative of three independent experiments. Time-course data (a–e) are representative of four independent experiments.

