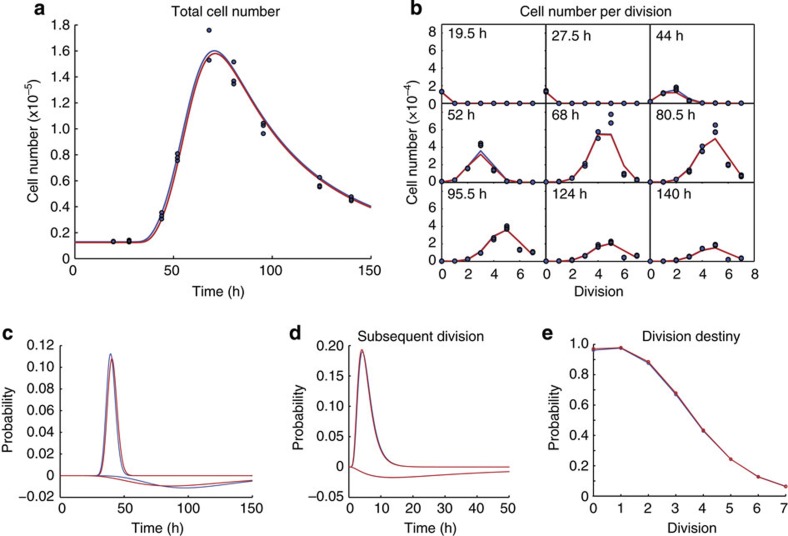
Figure 5. Cyton fitting to CpG concentration 3.0 mM.
In each case, the blue line show fits obtained from the cyton model with no constraints, whereas the red lines show the fits obtained with all the parameters for death and division times constrained to be equal for all CpG concentrations. (a) Total cell number as a function of time; here the blue points represent triplicate experimental observations. (b) Cell numbers per division at different time points; again the blue points are triplicate experimental observations. (c) Probability density functions for the division times of undivided cells and the negative probability density function of time to die for undivided cells. (d) Probability density functions for the division times of divided cells and the negative probability density function of time to die for divided cells. (e) Probability that the cells are division capable as a function of division.

