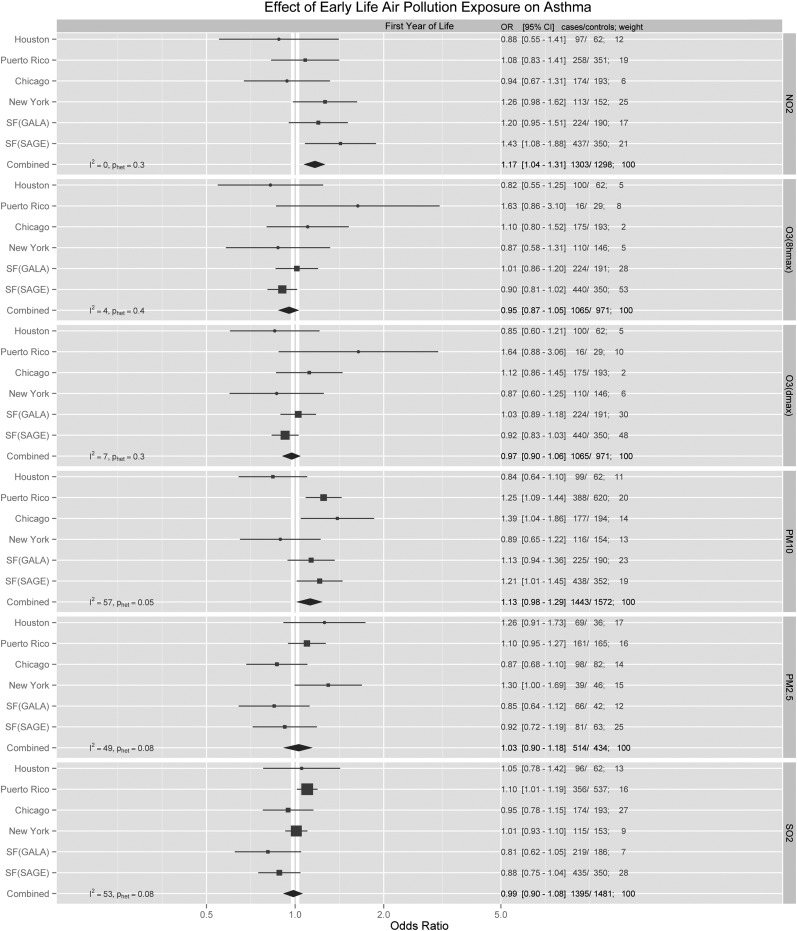
Figure 2.
Adjusted region-specific and summary odds ratio (OR) estimates for all pollutants during the first year of life. Region-specific analyses were adjusted for age, SES, income, and race/ethnicity, and then pooled using a random-effects model. For NO2 and O3 (1-h max, 8-h max), ORs were calculated for every 5-ppb change. For PM10, ORs were calculated for every 5-μg/m3 change. For PM2.5, ORs were calculated for every 1-μg/m3 change. For SO2, ORs were calculated for every 1-ppb change. CI = confidence interval; GALA = Genes–environments and Admixture in Latino Americans; NO2 = nitrogen dioxide; O3 = ozone; OR = odds ratio; PM2.5 = particulate matter < 2.5 μm in diameter; PM10 = particulate matter < 10 μm in diameter; ppb = parts per billion; SAGE = Study of African Americans, Asthma, Genes, and Environments; SO2 = sulfur dioxide.

