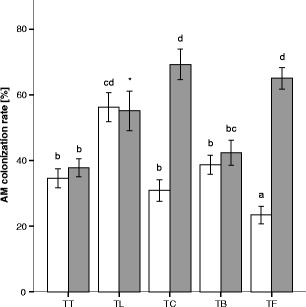
Fig. 1.

AM colonisation rate (%) of different plant species in different intercropping combinations (mean ± standard error). T = tomato, L = leek, C = cucumber, B = basil, F = fennel; empty bars represent the tomato plants and grey bars the corresponding intercropping partner. Plants were only inoculated with AMF. Different letters indicate significant difference according to ANOVA and Bonferroni’s test (P < 0.05). * excluded from statistical analysis
