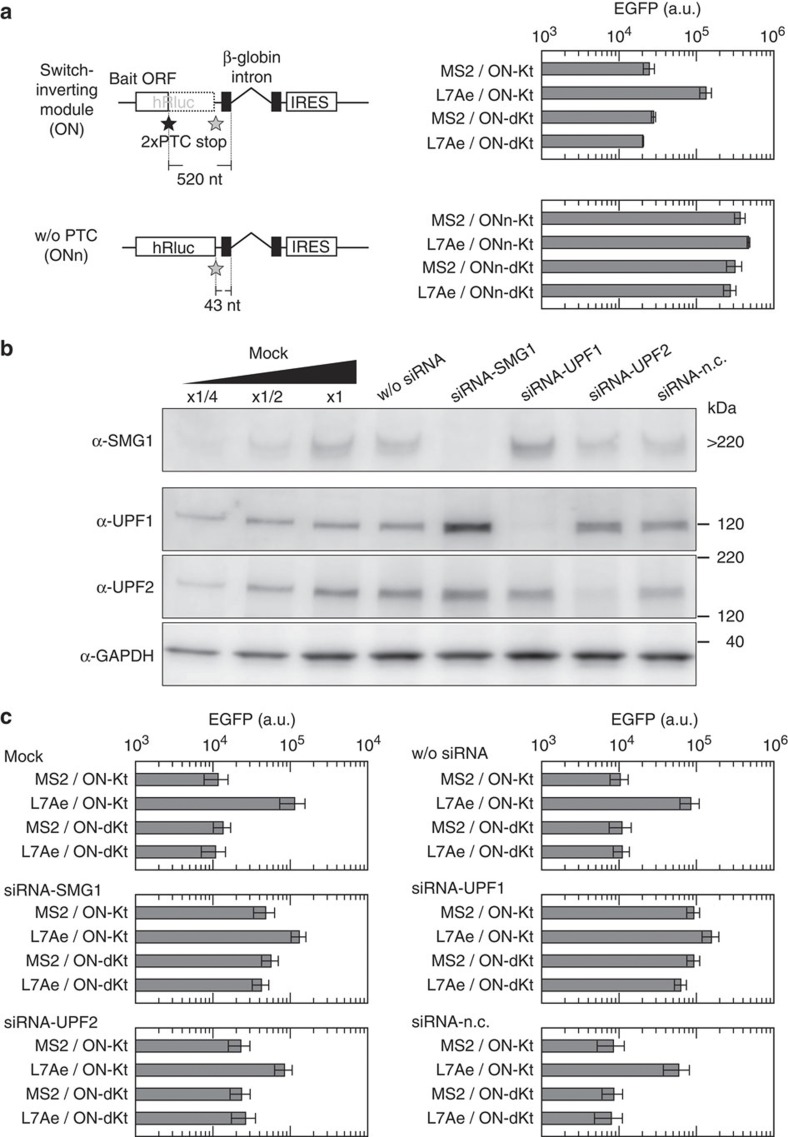
Figure 3. Dependency of inverted switches on PTC and NMD factors.
(a) A switch-inverting module without PTC (ONn). Schematic illustrations of the modules and EGFP fluorescence from switches inverted by the modules are shown in left and right, respectively. The level of EGFP was determined using a flow cytometer, BD Accuri (see also Supplementary Fig. S2), 24 h after transfection of 100 ng of the indicated OUTPUT plasmid with 20 ng of cognate and 480 ng of noncognate INPUT plasmids. Bars and error bars represent the mean and s.d., respectively, of three replicates. (b) siRNA-induced knockdown of NMD factors: SMG1, UPF1 and UPF2. siRNAs to SMG1, UPF1, UPF2 or a non-silencing negative control siRNA (siRNA-n.c.) were transfected into HeLa cells. Forty-eight hours after the transfection, total protein was extracted and subjected to western blotting analysis. Glyceraldehyde 3-phosphate dehydrogenase (GAPDH) was also analysed as an internal control of the lysates. w/o siRNA indicates cells treated with only transfection reagent. The left three lanes were twofold serial dilutions of the lysate from untreated HeLa cells (mock). (c) Behaviour of inverted switches in siRNA-treated cells. Forty-eight hours after the transfection of siRNAs, cells were transfected with the plasmids. Plasmid transfection and analytical procedure were the same as in a. Bars and error bars represent the mean and s.d., respectively, of three replicates. In a and c, cells were transfected with 100 ng of the indicated OUTPUT plasmid with 20 ng of cognate and 480 ng of noncognate INPUT plasmids.

