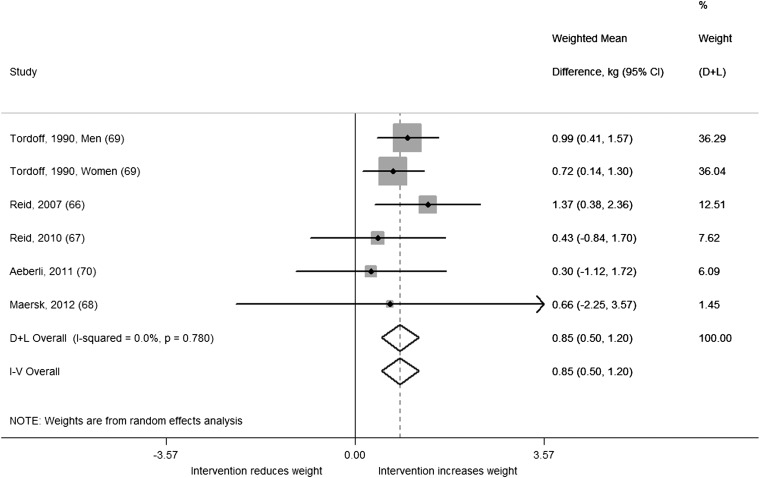
FIGURE 6.
Weighted mean differences (95% CI) in weight change (kg) between the intervention and control regimens from randomized controlled trials in adults. Interventions evaluated the effect of adding sugar-sweetened beverages. Horizontal lines denote 95% CIs; solid diamonds represent the point estimate of each study. Open diamonds represent pooled estimates of the intervention effect, and the dashed line denotes the point estimate of the pooled result from the random-effects model (D+L). Weights are from the random-effects analysis (D+L). Pooled estimates from the random-effects analysis (D+L) and the fixed-effects analysis (I-V) are shown based on 5 randomized controlled trials (n = 292). The I2 and P values for heterogeneity are shown. D+L, DerSimonian and Laird; I-V, inverse variance.

