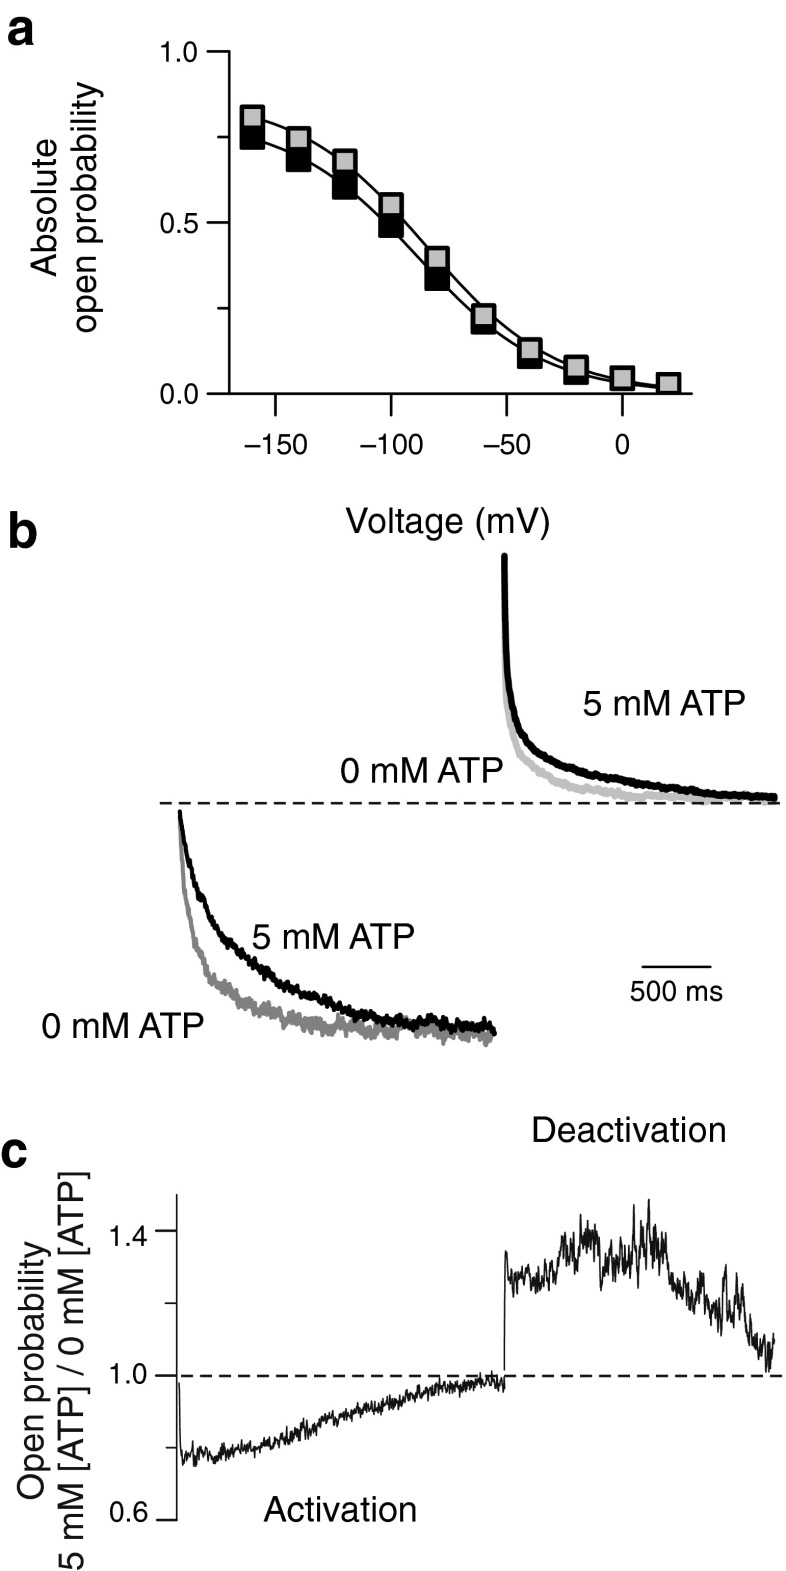
Fig. 2.
ATP modifies the time-dependent of ClC-2 open probabilities. a Voltage dependence of absolute open probabilities at 0 mM (grey squares) or 5 mM ATP (black squares) b, Superimposed current traces at −160 or at +100 mV to illustrate ATP-dependent changes in activation and deactivation. Recordings at 5 mM ATP are given as black lines whereas grey lines indicate ATP-free conditions. Mean current amplitudes for the last 50 ms of each voltage step were normalized to the steady-state absolute open probability at −160 or +100 mV. c, Ratio of current amplitudes at 5 versus 0 mM of internal ATP from the recordings shown in b to quantify the differences in open probabilities during hyper- and depolarizing voltage steps

