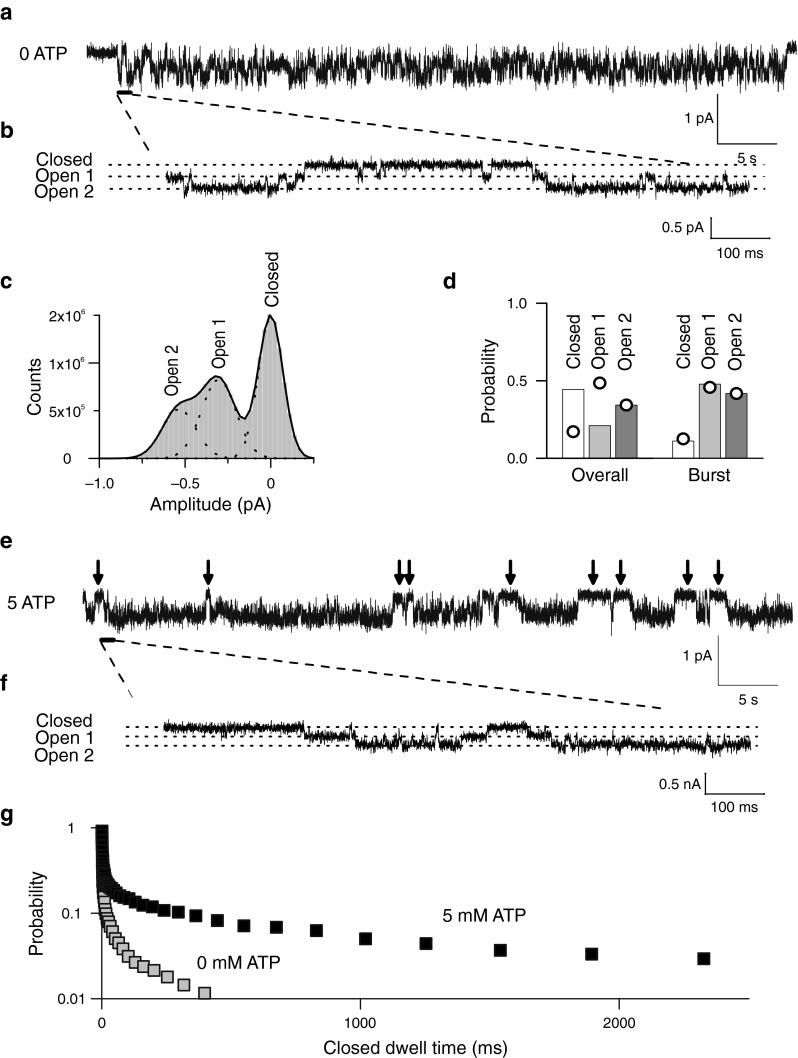
Fig. 4.

ATP modifies common gating of ClC-2. a Representative single-channel recording of WT ClC-2 at −100 mV and an internal ATP concentration of 0 mM. b Segment of a showing three separate conductance levels (closed, open 1, and open 2). c Histogram plot from the WT ClC-2 single-channel recordings shown in a. Solid line shows fit with a sum (black line) of three Gaussian (dotted lines) functions corresponding to the three separate conductance levels at approximately 0, 0.24, and 0.48 pA. d Probabilities of the three conductance states during bursts or from complete recordings. Values expected from binomial distributions were calculated assuming that the probability of the conductance state open 2 is the square of the protopore open probability and are shown as superimposed circles. e Representative recordings of WT ClC-2 channels at −100 mV and an internal ATP concentration of 5 mM. Arrows indicate long closed durations absent from the recording in a. f Segment of e showing three separate conductance levels (closed, open 1, and open 2). g Cumulative closed time distribution for WT ClC-2 at 0 mM (grey squares) or at 5 mM (black squares) of cytosolic ATP. For each abscissa value, the probability of encountering longer closed dwell times were taken from binned dwell time distributions
