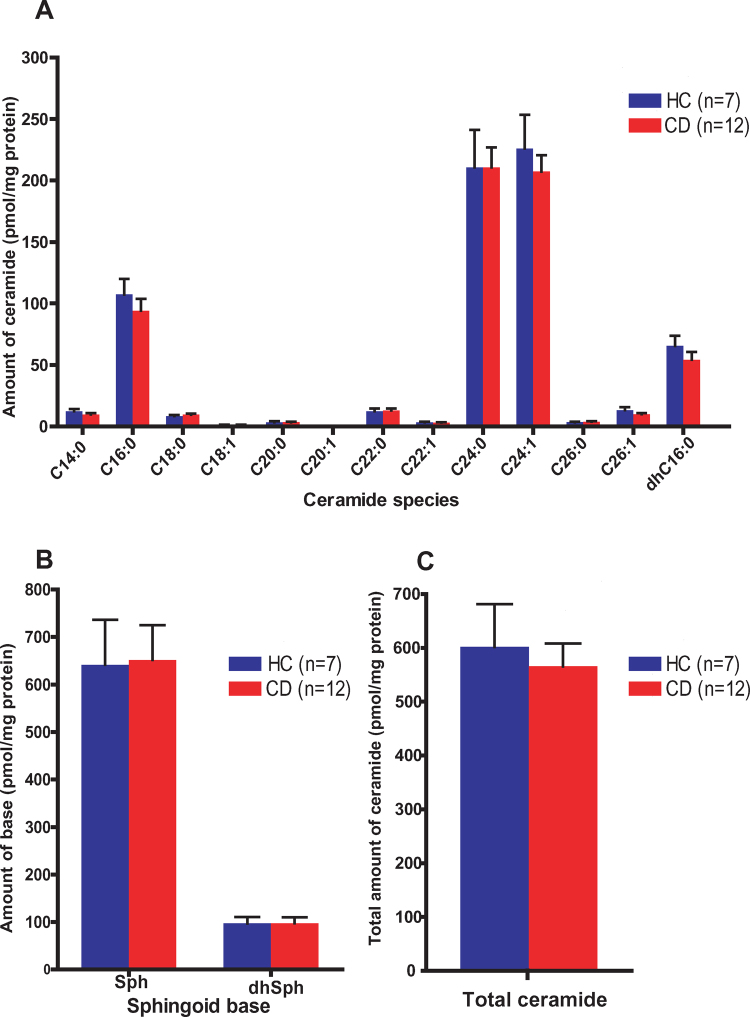
Supplementary Fig. 2.
Ceramide and sphingoid base composition of HkEc-stimulated HC and CD macrophages. (A) Amounts of individual ceramide species expressed as pmol/mg protein. (B) Amounts of sphingosine (Sph) and dihydrosphingosine (dhSph). (C) Total amount of ceramide. No significant differences were found between HC (n = 7) and CD (n = 12) macrophages. Results are presented as mean + SEM.

