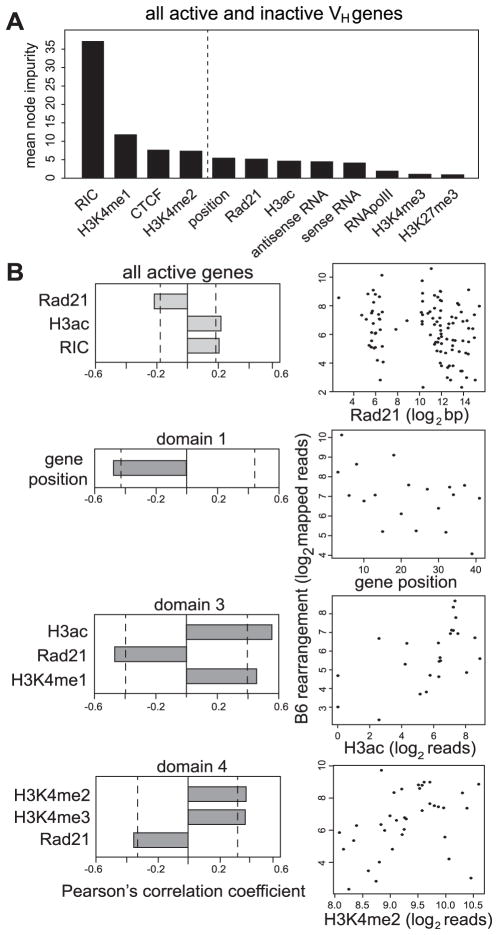
Fig. 7. Computation of accessibility parameters and their relation to recombination.
(A) Random forest classification of all parameters for all active and inactive VH genes. Dotted line indicates the threshold of statistical significance in the contribution of each parameter to model prediction. (B) Pearson’s correlation coefficient values for each parameter for all active genes only (n=105) or for the active genes in individual domains. Dotted line indicates significance threshold (p = 0.05). Scatter plots are shown for the best correlating parameter in relation to recombination frequency; all log2 transformed.

