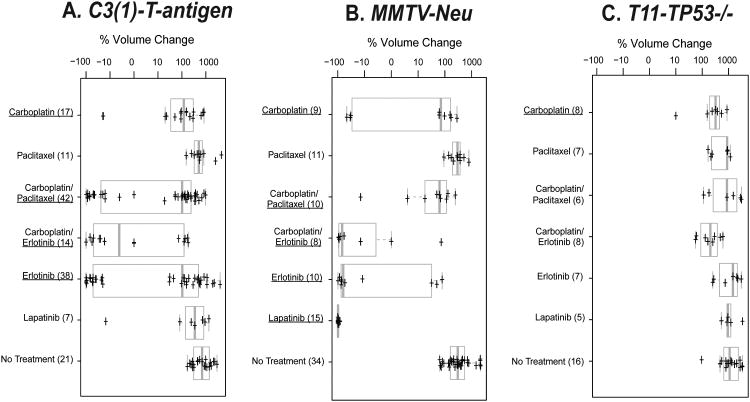
Figure 2. Short-term treatment responses for three mouse models of mammary cancer.
Box and whisker plots are shown as measures of tumor responsiveness. In each case, 2-3 cycles of therapy was administered for all chemotherapeutics (1 dose/week), while in the case of erlotinib and lapatinib, the drug was continuously administered via the chow. Tumor size was measured at baseline and at weekly intervals thereafter. The change in tumor volume over a 21-day treatment period is plotted for A) C3(1)-T-antigen model, B) MMTV-Neu model, and C) T11/TP53−/− model; note that the T11/TP53−/− model is based upon a 14-day treatment period due to its faster growth rate. Drugs that elicited a statistically significant response as assessed by a t-test when compared versus its matched untreated controls are identified by being underlined. The number of animals in each treatment group is indicated in parentheses.

