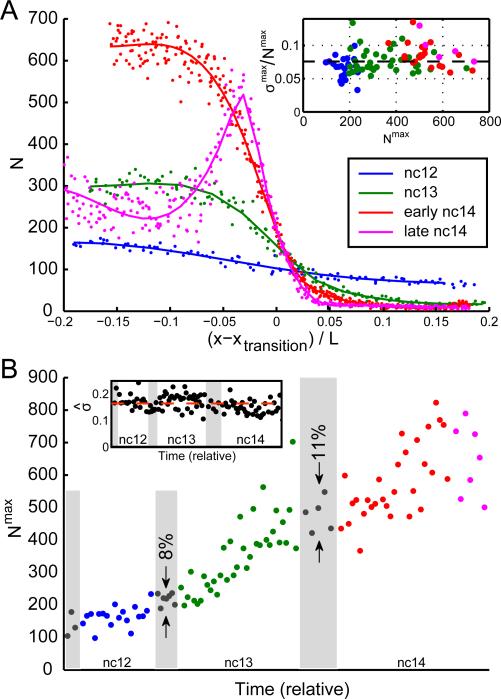
Figure 2. Precision and reproducibility of cytoplasmic hb profiles.
A: Absolute cytoplasmic hb mRNA counts per standardized volume as a function of AP position. Data for four embryos at nuclear cycle 12 (blue), 13 (green), early 14 (red), and late 14 (magenta). Position is shown as distance from inflection point xtransition (see also Figure S3C). Inset: fractional SD σmax/Nmax in the spatial domain of highest mRNA accumulation as a function of the mean count (Nmax) for 101 embryos. Dashed line at 8%. B: Cytoplasmic hb mRNA counts (Nmax) as a function of time. Ages estimated by visual inspection of DAPI staining; relative width of mitoses (gray shading) and interphases according to Alberts and Foe (1983). Reproducibility of counts in 12th and 13th mitoses is 8% and 11%, respectively. Inset: estimated reproducibility as a function of time. Data points: running averages of root-mean-square displacement from smoothed timeline over 15 consecutive data points normalized to mean. Dashed line: average (17%). See also Figure S3

