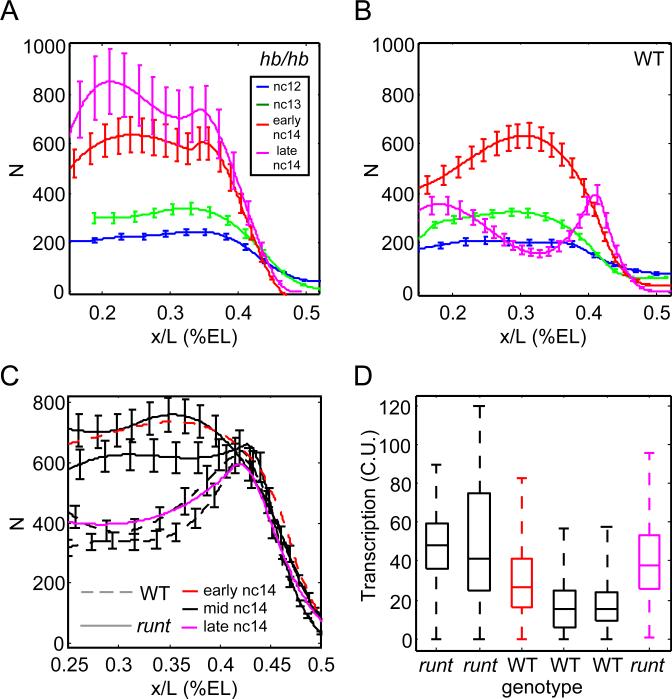
Figure 5. Mutations in hb and runt impair timely repression of hb expression.
A,B: Cytoplasmic hb mRNA counts per standardized volume as a function of AP position of similarly staged zygotic hb mutants (A) and WT siblings (B). Smooth profiles and error bars obtained as in Figure 2A. C,D: runt mutants show delayed repression of hb transcription in nc14. C: Solid lines: runt mutants; dashed lines: WT siblings. Black: embryos of similar age (mid nc14) as judged by DAPI. Profile of an early nc14 WT embryo (red line) resembles mid-stage runt mutants, whereas a very late runt mutant (magenta line) is similar to earlier WT siblings. D: Transcriptional activity in anterior nuclei of the embryos shown in C. Boxplot depicts median, quartiles, and range of nascent transcription site activity for each embryo. runt mutants display consistently higher hb activity compared to WT siblings, leading to the inappropriately high hb transcript counts at late times as shown in C. See also Figure S5.

