
Figure 4.
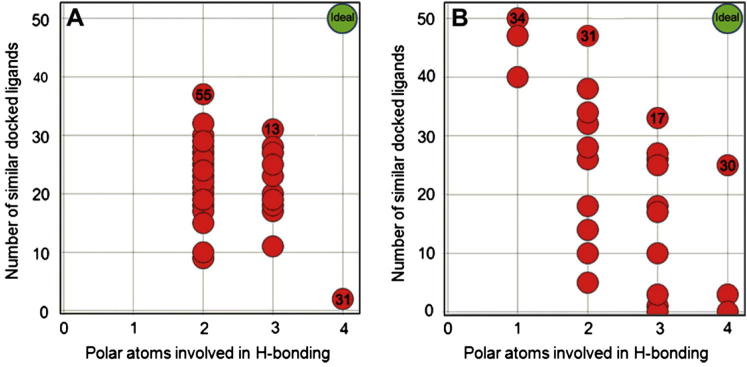
Trade-off surface for selecting the optimal ligand-induced ADP-derived protein conformation (A) and the optimal ligand-induced NSC109555-derived protein conformation (B). Each red dot denotes a different ligand-induced protein structure and numbers in bold within the dot denote the ligand used to generate the ligand-induced structure. For each plot, the x-axis denotes the number of polar atoms of the scaffold involved in hydrogen bonding in the respective ligand-induced structure; the y-axis denotes the number of docked ligands in the respective ligand-induced structure which show 0–4 polar interactions.