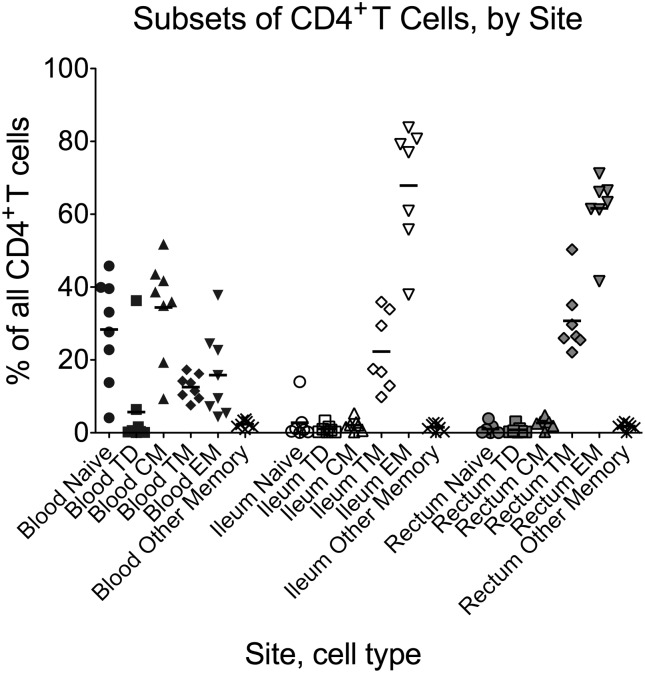
Figure 1.
Flow cytometry was used to determine the proportion of all CD4+ T cells from each site (blood, ileum, rectum) that were naive, terminally differentiated effector (Td), central memory (CM), transitional memory (TM), effector memory (EM), or “other memory” cells based on expression of CD3, CD4, CD45RO, CCR7, and CD27 (Table 1). Circles represent naive T cells; squares, terminally differentiated T cells; triangles, central memory T cells; diamonds, transitional memory T cells; inverted triangles, effector memory T cells; X's, all other memory T cells. Black, blood; white, terminal ileum; grey, rectum. Bars represent the means.

