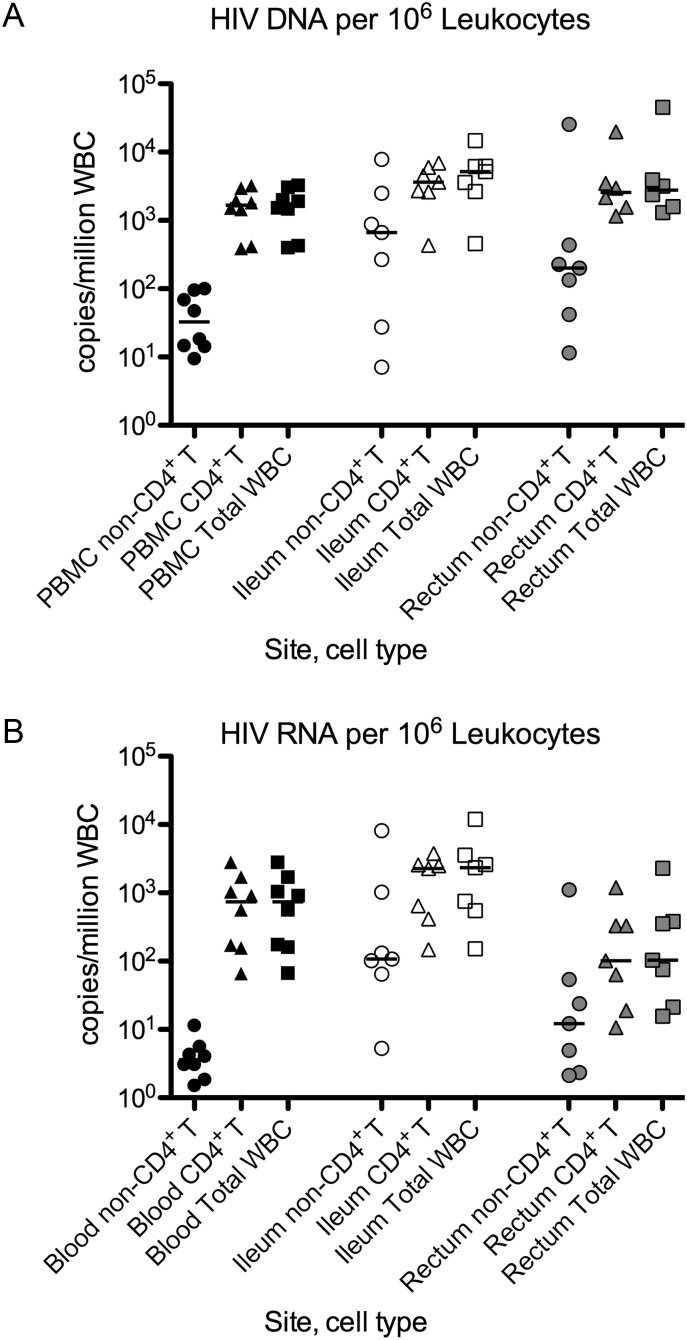
Figure 3.
A and B, HIV DNA (A) and RNA (B) with normalization to cell frequency (in 106 WBCs). For each site (blood, ileum, rectum), we used the HIV levels within each cell type (Figure 2) and the frequency of each cell type (% of live singlet CD45+ cells, as determined by flow cytometry) to calculated the HIV content within each cell type in 106 WBCs. Samples that had undetectable HIV levels were assigned a value equal to the detection limit of the assay. The HIV levels in TR7+, TTM, and TEM CD4+ T cells were added to yield an estimate of the total HIV level in CD4+ T cells (triangles), which was added to the level in non-CD4+ T leukocytes (circles) to give an estimate of the total HIV level in WBCs (squares). Data are shown on a log scale. Bars represent the medians. Abbreviations: HIV, human immunodeficiency virus; WBC, white blood cell.

