
Fig. 1.
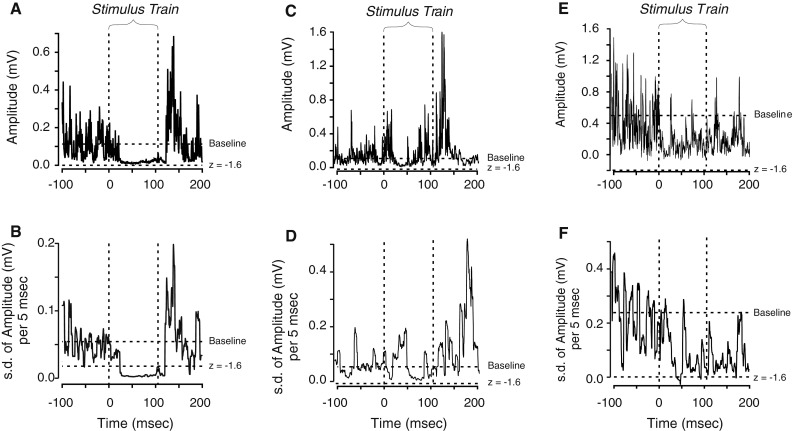
Detecting suppression events. The graphs show the time that the stimulus train started and finished as well as the baseline mean and the z score of −1.6. a, c, and e represent the average EMG waveforms; b, d, and f represent the average standard deviation of the EMG responses for a 5 ms moving window. In a, the quieter period during the train appears to indicate suppression, but the waveform does not stay below the −1.6 s.d. cutoff line and thus would not be considered a suppression response using a conventional analysis method. In b, however, the suppression event is well below the −1.6 s.d. level. Suppression not only reduces the amplitude of EMG, it also reduces its variability. c shows a response which was detected by visual inspection; however, the computer analysis (d) did not detect the event, so it was not included in the analysis. In e, no event was detected on visual inspection, yet computer analysis (f) detected the event so it was included in the analysis