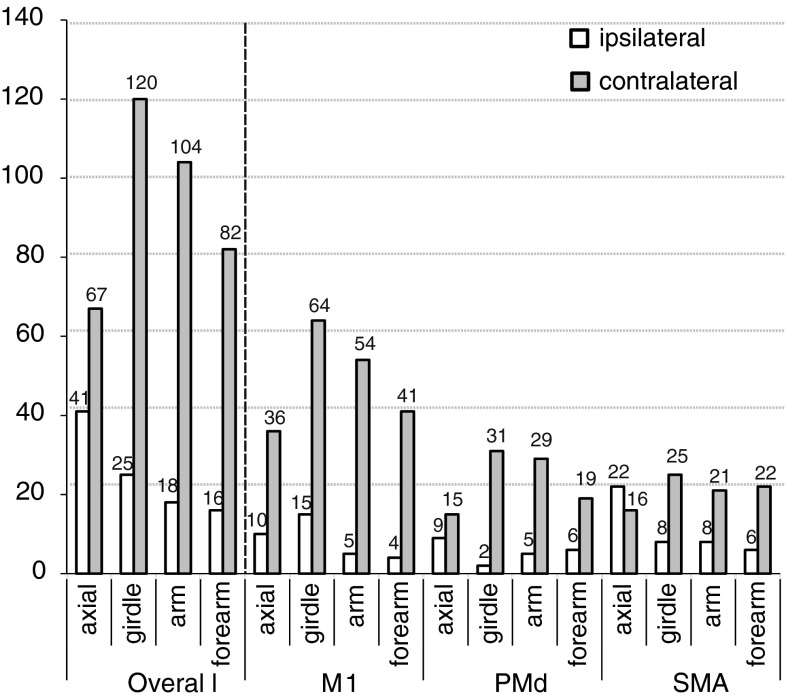
Fig. 5.
Graph showing the breakdown of ipsilateral and contralateral responses based on UL region for all the cortical areas combined (overall) and for each cortical motor area (M1, PMd, and SMA). The numbers above each bar in the graph represent the number of responses detected. The greatest proportion of ipsilateral responses occurred in the most proximal muscle groups (axial region; 38 %) compared with more distal areas, including the girdle muscles (17 %), arm (15 %), and forearm (16 %). The hatched line separates the overall responses from those for the individual cortical areas. SMA stimulation resulted in significantly more ipsilateral responses especially in the axial muscle compared to those for M1 and PMd

