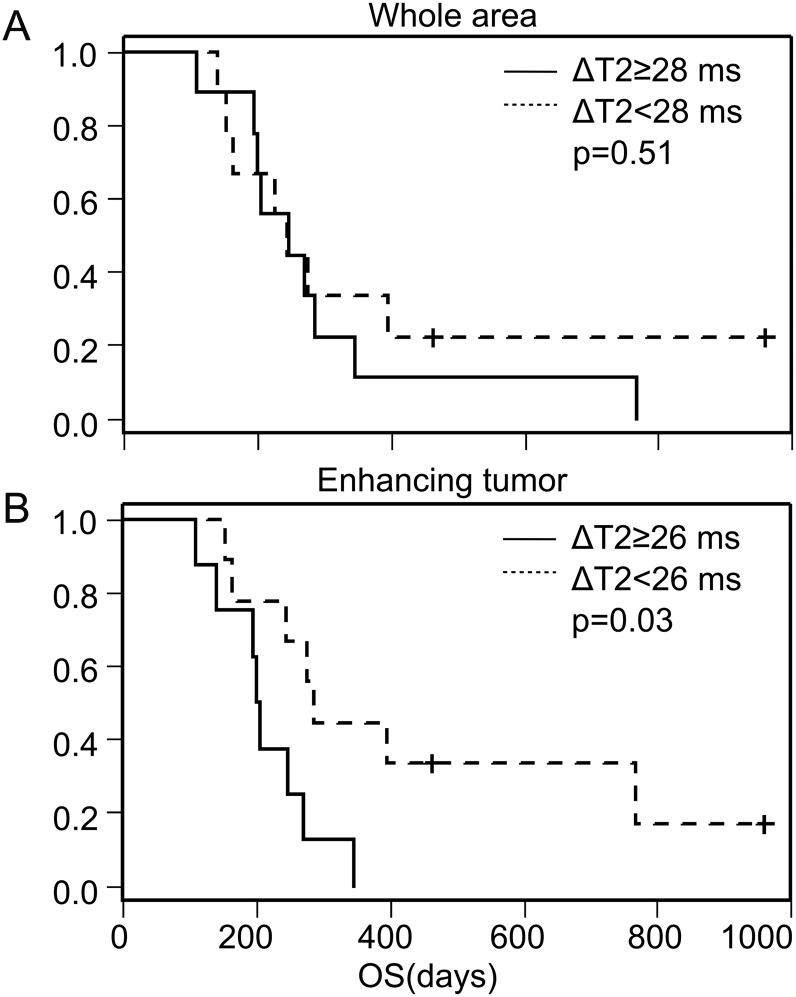
Fig. 7.
Kaplan–Meier curves for overall survival (OS) stratifying patients by the reduction of T2 relaxation time 8 weeks after start of bevacizumab using the median as a cutoff value. No difference is observed for the whole tumor (A), whereas patients with a T2 relaxation time decrease in the enhancing tumor of <26 ms had longer OS than those with ≥26 ms (B). Tick marks indicate the time of patient censoring. Changes in T2 relaxation time in edema and non-enhancing tumor volume were not predictive of survival (data not shown).

