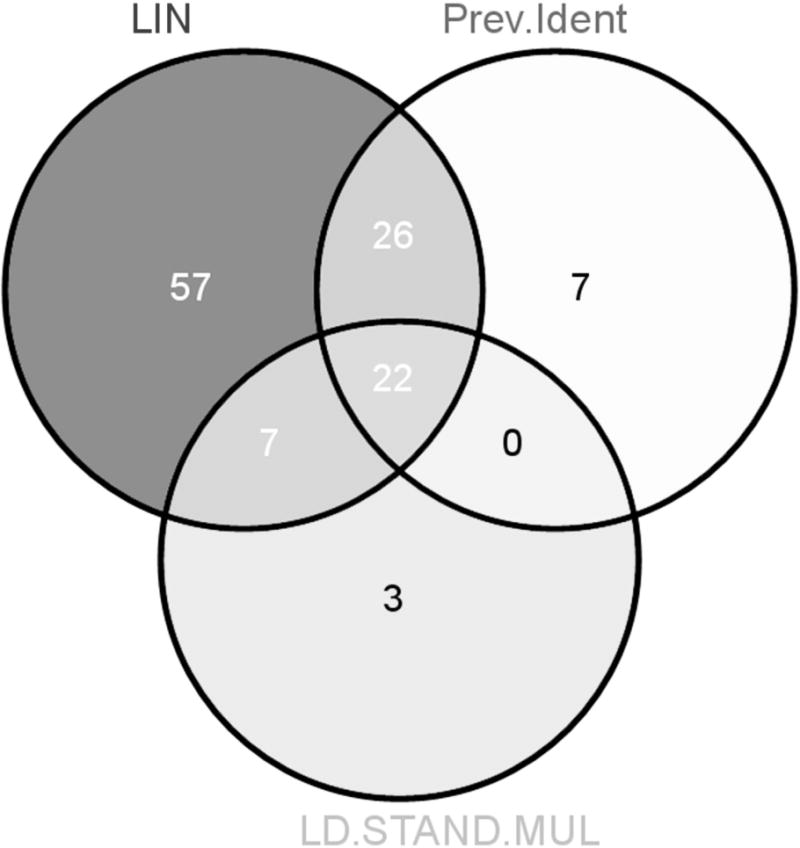
Figure 4.

Venn diagram of results obtained by different kernels and previous studies of RA Legend: Venn diagram demonstrating the overlap between significant results obtained by LKMT with LIN and LD.STAND.MULT version. We do not include results from any of the alternative kernel functions, to keep the Venn diagram clear. Also shown is the overlap with the previously implicated pathways (Prev.Ident).
