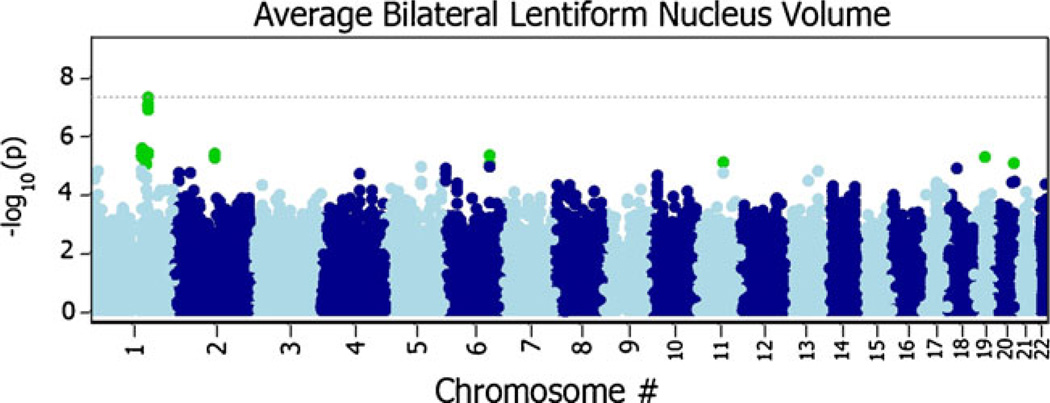
Fig. 5.
Manhattan plot of meta-analyzed P-values (PMA) from both the ADNI and QTIM samples (N=1345). Each plotted point is the – log10(PMA) of a given SNP sorted by chromosome. The dotted gray line denotes the standard, nominal genome-wide significance level – log10(5×10⁻⁸). Each point plotted above the gray line indicates a genome-wide significant SNP

