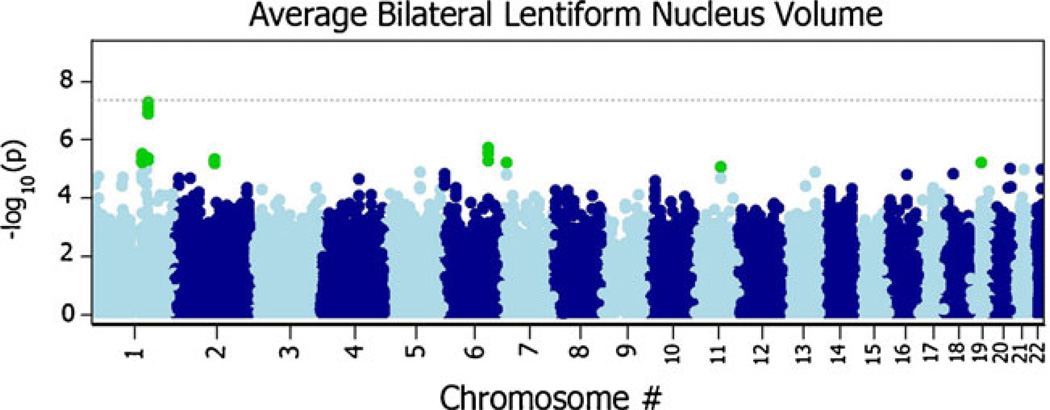
Fig. 7.
Manhattan plot of meta-analyzed P-values (PMA) from both the ADNI and QTIM samples (N=1345) using a random effects model (Han and Eskin 2011). Each plotted point is the −log10(PMA) of a given SNP sorted by chromosome; points plotted higher on the y-axis are more significant. The dotted grey line denotes the nominal genomewide significance level −log10(5×10⁻⁸). The results are consistent with those found using the standard fixed effects analysis

