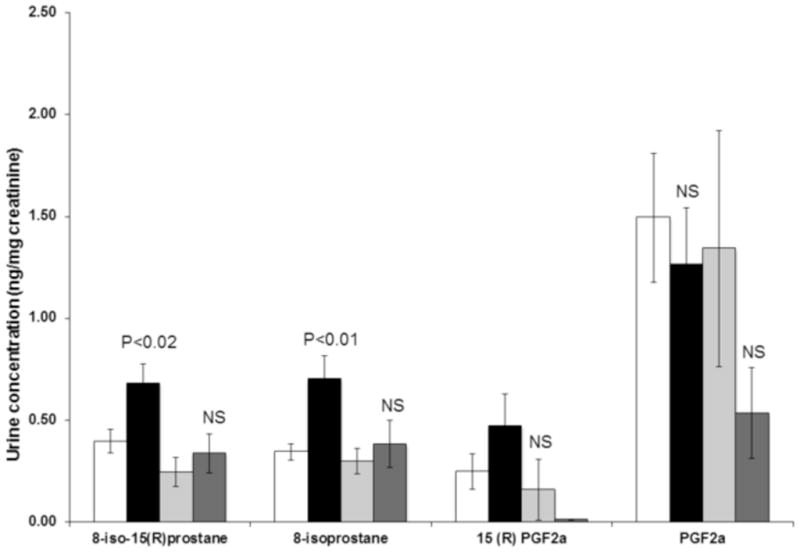
Figure 4.

Isoprostane and PGF2α levels before and after cardiac surgery. Values are expressed as means ± SEM and p-values indicate the significance of differences between values before and after surgery. The white boxes are values for patients without acute kidney injury prior to surgery; the black boxes are values after surgery in these patients. The light gray boxes are patients with acute kidney injury prior to surgery; the dark gray boxes are values after surgery in these patients. The statistical significances are for differences between pre- and post-surgery values.
