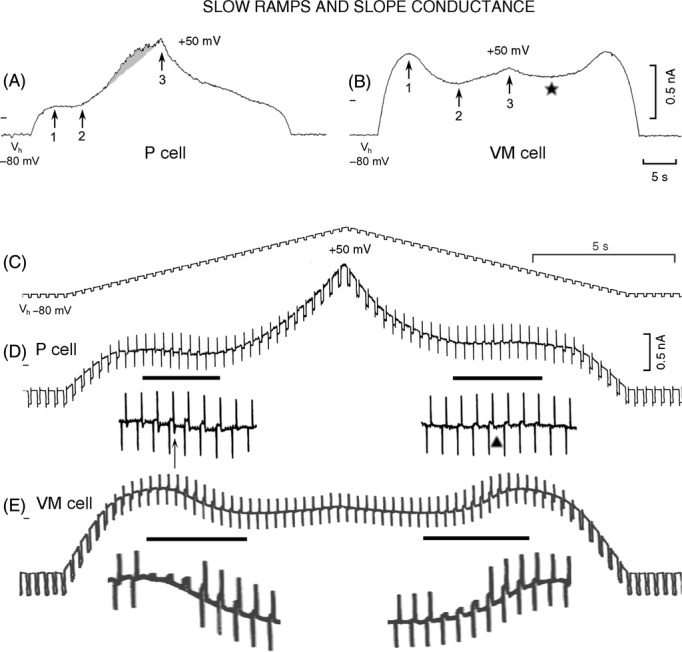
Figure 6.

I-V relation and changes in slope conductance during slow ramps in P and VM cells. A 6.5 mV sec−1 depolarizing and repolarizing ramp was applied to a P cell (A) and to a VM cell (B). Point 1 indicates the IK1 peak, point 2 the beginning of increasing outward current, and point 3 the current at ramp peak. In A, the shaded area indicates the enhancement of the outward current (“the bulge”). In B, the asterisk indicates the transition between the decreasing outward current and the beginning of IPS. Hyperpolarizing voltage pulses (amplitude 7 mV, duration 200 msec, rate 90 min−1; C) were superimposed on the parent ramp to measure slope conductance. In D (P cell) and E (VM cell) (same heart but different from that for A and B), the horizontal lines indicate the sections of current records shown at higher gain underneath. In D, the upward vertical arrow points to an inward transient after the reversed pulse current and the triangle points to its absence. In the enlarged sections of VM trace, some of the capacity spikes have been deleted for a better visualization of the increase and reversal of pulse current in the NS and PS regions.
