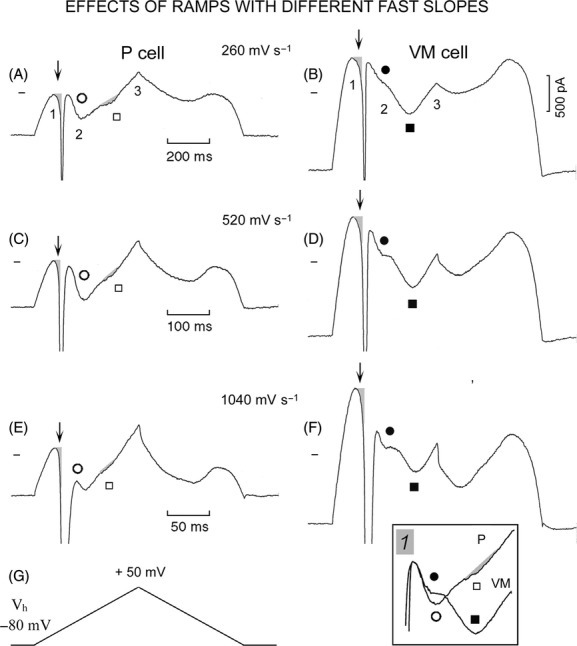
Figure 7.

I-V relation during steep ramps in P and VM cells. The 260, 520, and 1040 mV sec−1 ramps were applied from Vh −80 to +50 mV (G) to a P cell (A, C, and E, respectively) and a VM cell (B, D, and F, respectively). The numbers 1, 2, and 3 label the peaks of IK1, of INS, and of the ramp, respectively. INS is labeled by empty circles in the P cell and by filled circles in the VM cell. The inward component attributable to ICa is labeled by empty squares and small shaded areas in the P cell, and by filled squares in the VM cell. In VM cells, ICa was measured from its beginning (taken as the point at which the slope of INS met the backward extrapolation of ICa) and ICa peak. The downward vertical arrows point to the slowly increasing inward current (shaded areas) preceding the activation of INa1. In inset 1, the traces from C and D were superimposed by the end of INa1 inactivation. In both cells, INa1 was cut off by the saturation of the amplifier at −10 nA.
